
Fault Tree Analysis: Uncovering The Root Causes Of More Complex Problems
By Ben Locwin, Ph.D.
 Part 3 of Identifying And Resolving Errors, Defects, And Problems Within Your Organization — a five-part series on operationalizing proper improvement techniques
The first article in this series was focused on identifying manufacturing trends so you can know when to act and when to let your processes run without interference. In part 2, I covered at a deep and nuanced level the fishbone diagram and its myriad uses. This article focuses on the concepts and practice of using fault tree analysis (FTA), which is empirically one of the most effective problem-solving tools in existence.
Why A Tree?
Just as the fishbone diagram has a structure resembling the bones of a fish, this problem-solving tool has a structure reminiscent of a tree, owing to its branching roots. The tree represents a defect or nonconformance. As you look out across your organization, you can detect the various trees popping up all over the place, representing errors and problems that have been unaddressed.

Tree vs. fault tree — see the similarity?
When you find a problem, this is called the sentinel event on the fault tree diagram, and it is listed at the top (see diagram above right).
From there, you’ll ask “why” or “how” something went wrong to lead to that particular problem (failure or defect). Then, you list in a row below the sentinel event the issues that could have occurred to lead to the error. This first row is typically a few to several discrete elements that could have led to the problem occurring.
Next, start with any of the elements in the first row below the sentinel event and ask the same question of that element: “Why” or “how” could this [element] have occurred? Beneath that element, you will begin to list all of the causative or correlative elements that could have led to it. Next, move to your next element in row 1 and do the same thing. Typically, I would do this in a left-to-right fashion and then progress to the next row down, as shown here:
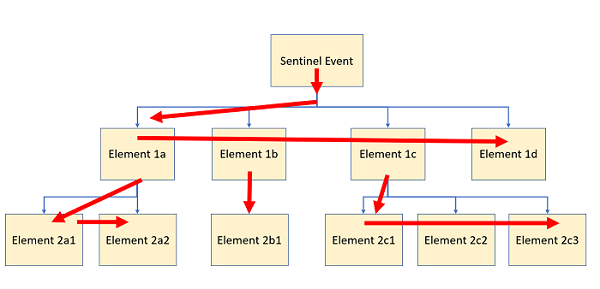
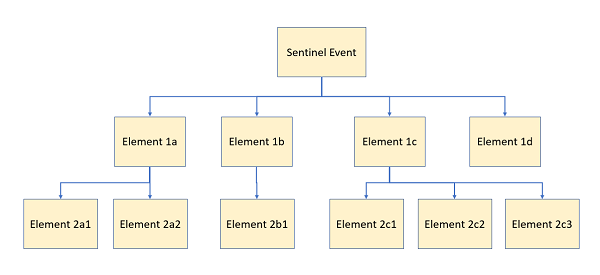
How to populate a fault tree: Start at the sentinel event (top), then work down one row to each sub-element. Then begin with Element 1a and ask why and how that element (1a) could have occurred. This will give you your second-row elements. Then move to Element 1b and do the same thing, and so on. As a subtle psychological cue, I’ve made the element boxes the shape and size of Post-It notes to remind you that you can build these using paper stuck on a wall and move them around as needed.
Connecting The Concept Of 5 Whys To The Fault Tree
One of my innovations for the fault tree was creating the linkage between how a fault tree functions and the logic of 5 Whys, the problem-solving approach that involves asking several iterative “Whys” or “Hows” to get to the root causes of a problem. The fault tree is what I’ve called “the visual analog of the 5 Whys,” because it allows you to drill down into the causal factors to look for root cause. But, expanding beyond the 5 Whys, this tool allows you to see where bifurcations (or trifurcations, etc.) occur in causality (i.e., typically there are a couple to several reasons acting in tandem as to why a particular thing went wrong, so you can capture all of them). After reading this, you’ll no longer have to be shackled to using these two tools (5 Whys or fault tree) in isolation. In fact, they’re two forms of the same inductive reasoning.

“Ask 'why' five times about every matter.” – Taiichi Ohno, conceptual founder of the Toyota Production System (which was the progenitor of lean methodologies worldwide).
The following component from a previous article shows the linkage between the 5 Whys and the fault tree:
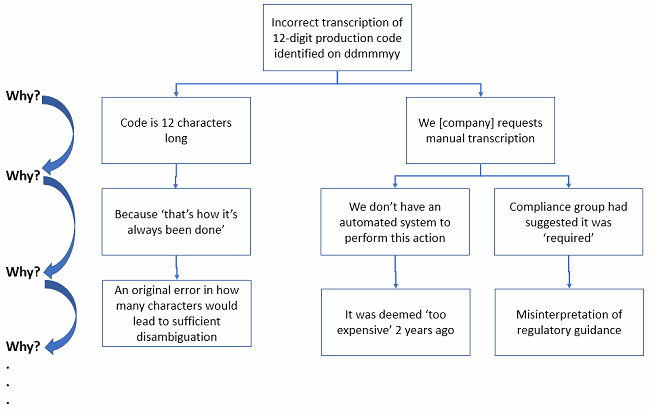
Note: The 5 Whys representation is shown on the left, and the fault tree analog is on the right. Each layer down in the fault tree analysis is equivalent to asking another “why” or “how.”
The problem with 5 Whys that most people miss when they use it, is that because it’s fundamentally linguistic, it sets up a cognitive situation of linearity. What this means is that because the 5 Whys has the protagonist asking “why,” the expectation is a single answer. In other words, 5 Whys isn’t well designed for multivariate or complex causality. The fault tree, however, is ideal for this purpose. And because of this, fault tree analysis is much better for mapping reality.
Here’s another example for you to analyze of a safety hazard in order to prevent future recurrences:
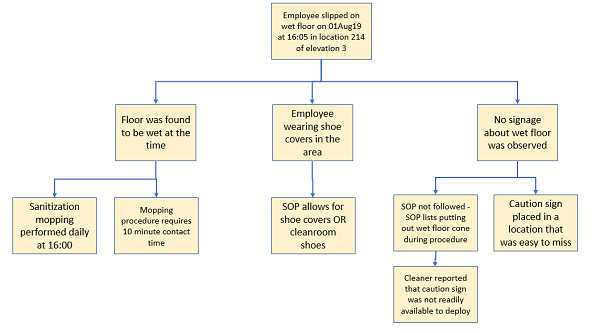
Let’s follow this one carefully: In the sentinel event in the diagram above, as I’ve suggested in the article on the fishbone diagram, the best practice is to include as much relevant event information as you can to help the problem-solving team. “Who, what, when, where, and how” are all elements you should consider. In the above example, I’ve seen many instances where a site would have listed something like “employee slipped on floor.” That doesn’t say where (if there’s a systemic spatial area that keeps causing issues), it doesn’t say what time (in case time is an investigative factor of note), and it doesn’t describe the nature of the situation (i.e., wet floor). These are all elements that matter to a proper investigation.
Then we begin (from our properly-specified event statement) to ask why this event was allowed to happen. Why do I say “allowed”? Because world-class safety investigations have built-in considerations that if someone suffers an incident, it’s specifically because management systems allowed it to occur.
Back to our fault tree: The floor was found to, in fact, be wet, and that’s related to the falling event. Also noted in the next box to the right on the first interrogative row was that the employee was wearing shoe covers at the time of the fall. This is an important piece of forensic information. And the far-right element notes that there was no sign observed by the employee at the time of the event – we’ll deal with this element later.
Now let’s go to the second interrogative row, beginning under “floor was found to be wet…”: Investigation determined that a sanitization mopping of that area of the facility occurs daily at 16:00, which was in fact about 5 minutes prior to the employee’s fall. Also answering the question of why the floor was found to be wet, there is a separate branch that the cleaning SOP requires enough water and cleaning fluid to be used such that the floor is wet for a minimum of 10 minutes (for adequate microbial activity). Then moving to the middle node, why was the employee wearing shoe covers? Because it was allowed per the procedure (either shoe covers OR cleanroom shoes). In this particular instance, the shoe covers are an important contributory factor because the tacky material on their bottoms, which is supposed to help the shoe covers provide a bit of friction (rather than acting like a sock), actually gets more slippery when wetted, and so shoe covers should never be allowed in areas where there is a potential for liquids to be present on the floor. If this isn’t systematized in this way, you’re basically tacitly acknowledging that a certain proportion of slips and falls will occur every week, month, or year by giving employees the option to wear shoe covers when you have data to suggest they become slippery and dangerous when they’re wet.
And, finally, we get to the right-most elements underneath “no signage,” where we find that either the SOP to have the facility cleaner place signage on the floor during the procedure wasn’t followed OR potentially that the sign was placed but wasn’t seen (or remembered) by the employee. Let’s discuss for a moment the futility of signage: People don’t read signs, and if they see them, they may not cognitively register them. How many times have you seen people pushing on a door that was clearly (and accurately) labeled “Pull”? Or maybe think about how many speed limit signs you passed on the way to work this morning? I’m sure they were there, and most of them you didn’t read or register.
When people are put in experimental conditions to act or not act in certain ways based on what’s written on signs, there is often no correlation with changes in behavior, and asking them later if they recall what the signs said often has them reporting that they don’t remember if they saw the sign or what it said. To that end, you could never have a preventive retraining on the topic of “employees need to read signs.” Signs do not systematically cause or prevent behavior.

This sign has never been associated with a statistically-relevant reduction in people slipping on wet floors. This is not a helpful sign for your employees, either. They probably hate it — just ask them.
Having a sign telling people not to fall on the floor is NOT a systemic preventive measure. Your employees don’t read signs because there are too many hanging around the facility, and they certainly don’t want to fall on the floor.
Finishing out the elements on the far-right side, in the lowest element on the far right, during the investigation it was found that the cleaning personnel couldn’t find the sign to install at point of use during the mopping and 10-minute residence time of wet floor. This could indeed be a deviation if the sign wasn’t found and used as specified in the SOP; however, note that whether or not it is a deviation is not the same as whether or not the procedure is effective. A sign in this case is entirely unhelpful, so it wouldn’t matter if the sign was there or not, but you still could have a process deviation incurred for not following the procedure. To this point, please consider how your SOPs are written and whether they actually prescribe truly effective activities (i.e., activities that are demonstrably influencing your site’s objective performance).
Establishing Robust CAPA: The Whole Point Of Fault Tree Analysis
Returning to the exemplar fault tree above, I’ve purposely left the lower rows incomplete, so you can give some thought as to what you might expect to see. As we probed this fault tree more deeply, we would start again on the left side and ask why sanitization mopping is performed at 16:00 each day and why the procedure requires 10 minutes of contact time. In thinking about solving the root cause (employee fell), you could begin to think that, while a daily mopping may be required for facility upkeep and for environmental monitoring purposes, it could be done at a different time when there is reduced foot traffic. This would prevent the “human: wet floor” interaction and therefore make it much less likely for someone to have a fall hazard. Maybe you could even consider changing cleaning regimens to something that doesn’t require 10 minutes of dwell time. And/or you could disallow shoe covers to be worn if your facility data suggests that cleanroom shoes are associated with fewer slip/fall events. Let the data be your guide to the best solutions and combine approaches for maximum likelihood of success.
There’s almost a 100 percent serial correlation between a dumb idea and the initiation of a useless CAPA.
Now, one of my most frequent warnings in the field of root cause analysis is that creating CAPAs that don’t address the root cause(s) of issues is worse and more risky than not doing anything at all. For you may find yourself in a situation where you’ve caused more unintended consequences than you could have ever expected, and you may compromise the operations of other processes. At least if you had elected to do nothing, you could let the status quo prevail. The whole point is to find the proper root cause(s) so you can create reliable CAPAs.
Complexity And Gates
There are some versions of fault trees in which various nodes and gates are added to the structure to allow for a more nuanced approach. In general and for the most part, these gates are pretty unhelpful. The best thing you can do if you need to create a fault tree is not to look at Google or Google images for examples, because you’ll be confused by various formats that were created by people who don’t know how to use them. These are symbols in search of a fault tree, not the other way around.
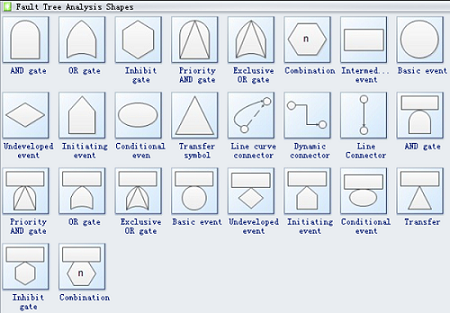
Note: Most of the artificial complexity in this nonsense above will not help your root cause analysis performance at your facility. Instead, grab a smart team, some flipcharts, Post-It notes, markers, pens, etc. and get to work.
Conclusion
A refreshed approach to fault tree analysis can be an incredibly helpful addition to your problem-solving armamentarium. Having the confidence to begin using it — or begin using it more often — is the first step to getting more comfortable with it and mastering its effects and nuances. I hope you see now how the fault tree itself is a multivariate and visual version of doing a 5 Whys assessment. This is a good thing, because 5 Whys is generally accepted as “the” tool to use for root cause analysis (RCA). Now you know that you can make 5 Whys and RCA even better by using a tool to allow for emergent complexity in the issues you’re trying to solve.
If you have issues at your facility that you’d like to discuss, please mention them in the comments below. If you have problem-solving examples using fault trees that you’d like help with or to highlight, please include those below, and our multidisciplinary readership can weigh in to bring our industry forward to the future.
The next article in this series will explore the Contradiction Matrix, whose logic is underpinned by a quote from Sherlock Holmes in The Sign of the Four: “When you have eliminated the impossible, whatever remains, however improbable, must be the truth.”
About The Author:
 Ben Locwin, Ph.D., MBA, MS, MBB, is a pharma executive and a member of several advisory boards and boards of directors across the industry and was the former president of a healthcare and pharma consulting organization. He created many of the frameworks for risk management and advanced process improvement currently in use within the industry and has worked across the drug life cycle from early phase to commercial manufacturing and marketing (GLP, GCP, GVP, GMP). He has also taught various structured problem solving methodologies to forensics analysts and crime scene investigators in the U.S. and internationally. He frequently keynotes events and conferences on these current topics. Connect with him on LinkedIn and/or Twitter.