
Using Trending As A Tool For Risk-Based Thinking
By Mark Durivage, Quality Systems Compliance LLC
Probably the most significant concern for anyone responsible for implementing, deploying, and maintaining a quality  management system is the integration of risk-based thinking. While the concept of risk management is not new, previous practice was more reactionary, primarily focusing on detection after the fact, root cause analysis, corrective actions, and preventing recurrence of the failure. Contemporary thinking places the emphasis on considering risks up front (prevention) and having a solid approach to address risk in planning, managing, and driving actions.
This article will present definitions and requirements pertaining to process and performance trending and introduce some trending tools that can be utilized throughout the QMS.
Definitions And Background
There several International Organization for Standardization (ISO) standards, FDA regulations, and international guidance documents that provide direction and lay out the framework for successfully implementing, maintaining, and sustaining an effective and robust quality management system regardless of its type or size, or the products and services it provides, requiring the use of risk-based thinking. The following requirements speak, although not directly, to the use of trending.
ISO 9001:2015 Quality management systems — Requirements
9.1.1 General
The organization shall determine:
a) what needs to be monitored and measured;
b) the methods for monitoring, measurement, analysis, and evaluation needed to ensure valid results;
c) when the monitoring and measuring shall be performed;
d) when the results from monitoring and measurement shall be analyzed and evaluated.
ISO 13485:2016 Medical devices — Quality management systems — Requirements for regulatory purposes
8.1 General
The organization shall plan and implement the monitoring, measurement, analysis, and improvement processes needed to:
a) demonstrate conformity of product;
b) ensure conformity of the quality management system;
c) maintain the effectiveness of the quality management system.
This shall include determination of appropriate methods, including statistical techniques, and the
extent of their use.
21 CFR 211.42 Design and construction features
(iv) A system for monitoring environmental conditions;
21 CFR 211.110 Sampling and testing of in-process materials and drug products
(a) To assure batch uniformity and integrity of drug products, written procedures shall be established and followed that describe the in-process controls, and tests, or examinations to be conducted on appropriate samples of in-process materials of each batch. Such control procedures shall be established to monitor the output and to validate the performance of those manufacturing processes that may be responsible for causing variability in the characteristics of in-process material and the drug product.
(1) Tablet or capsule weight variation;
(2) Disintegration time;
(3) Adequacy of mixing to assure uniformity and homogeneity;
(4) Dissolution time and rate;
(5) Clarity, completeness, or pH of solutions.
(6) Bioburden testing.
21 CFR 820.75 Process validation
(b) Each manufacturer shall establish and maintain procedures for monitoring and control of process parameters for validated processes to ensure that the specified requirements continue to be met.
(2) For validated processes, the monitoring and control methods and data, the date performed, and, where appropriate, the individual(s) performing the process or the major equipment used shall be documented.
21 CFR 820.100 Corrective and preventive action
(1) Analyzing processes, work operations, concessions, quality audit reports, quality records, service records, complaints, returned product, and other sources of quality data to identify existing and potential causes of nonconforming product, or other quality problems. Appropriate statistical methodology shall be employed where necessary to detect recurring quality problems;
(2) Investigating the cause of nonconformities relating to product, processes, and the quality system;
21 CFR 820.198 Complaint files
(b) Each manufacturer shall review and evaluate all complaints to determine whether an investigation is necessary. When no investigation is made, the manufacturer shall maintain a record that includes the reason no investigation was made and the name of the individual responsible for the decision not to investigate.
21 CFR 820.200 Servicing
(b) Each manufacturer shall analyze service reports with appropriate statistical methodology in accordance with 820.100.
Trending Techniques Make Effective Use Of Resources
We all realize there are unlimited needs and limited resources to support those needs. Trending techniques can help an organization focus the company’s limited resources where they are needed the most. Trending is simply using a statistically based control chart to monitor an activity or process. Just as traditional control charts used for monitoring a manufacturing or production process use statistical control limits based on the standard deviation (usually 2σ or 3σ), trending charts are usually constructed using threshold limits, alert limits, or action limits. When one of those limits is exceeded, an investigation is triggered in order to determine if further action is required. The initial investigation will help determine the need for a formal corrective and preventive action (CAPA).
Get Mark's techniques for establishing and justifying the number of process validation runs.
How To Establish The Number of Runs Required For Process Validation
There are two types of variation present in every process: common causes, which are sources of variation that are inherent in every process, and special causes, which are sources of variation that arise because of special circumstances. Common cause variation affects every outcome of the process and everyone working in the process and is referred to as the noise of the process. Common cause variation is generally considered to be the responsibility of management.
Special cause variation is not an inherent part of a process. Special causes are also referred to as assignable causes, and they are generally considered to be the responsibility of the workers.
Trending is also a good way to establish how much common cause variation (noise of the process) is present in the process and determine whether special cause variation (assignable cause) is present.
Control charts (trending charts) usually contain a centerline (the mathematical average of the sample or subgroup), upper and lower statistical control limits that define the constraints of common cause variation, and performance data plotted over time.
There are two general classifications of control charts: variable charts and attributes charts. Variables charts are used for things that can be measured, such as weight, length, temperature, etc. Attributes charts are for things that are counted or rated as pass/fail. Table 1 lists the various types of variable and attribute control charts and their applications.
Table 1: Variable and Attribute Control Chart Types and Applications
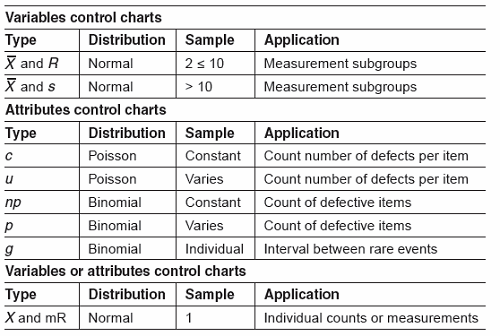
When a process is in statistical control, meaning that only common cause variation is present, 68 percent of the data will fall within ±1σ of the process average, 95 percent of the data will fall within ±2σ of the process average, and 99.7 percent of the data will fall within ±3σ of the process average.
I generally advise companies to use ±2σ of the process average for alert limits and ±3σ of the process average for action limits. However, I have seen ±1.5σ and ±2.5σ used successfully.
How To Deal With Outliers
Occasionally, a process will drift or even go out of control, indicating the presence of special cause variation. When the process does go out of control, the data points may be considered outliers. Outliers should be investigated and removed from the data used to make the calculations for the process centerline and for the control and trend limits. Using the special cause variation data can/will affect the control limit and trend limit values or, as I like to call it, the elimination of bonus statistical tolerance.
We need to consider removing outlier data points:
- to provide a realistic picture of a process
- to provide meaningful control limits
- to prevent “bonus” statistical control limits
- to ensure actions are taken only when appropriate
There are several visual and analytical tools that can be used to determine if the suspect points are indeed outliers. Each outlier detection method has certain rules and unique applications. The analytical methods include:
- Outlier detection based on the standard deviation for a normal distribution
- Discordance outlier test
- Outlier detection based on the standard deviation for an unknown distribution
- Outlier detection based on the interquartile range
- Dean and Dixon outlier test
- Grubbs’ outlier test
- Walsh’s outlier test
- Hampel’s method for outlier detection
Normal curves, control charts, and box plots can also be used to detect outliers visually.
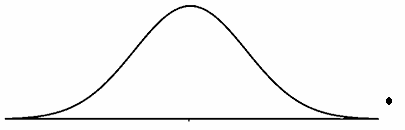
Figure 1: Normal curve with an outlier
The normal curve shown in Figure 1 has an outlier to the far right of the normal curve. Please note the point is above the axis to provide clarity.
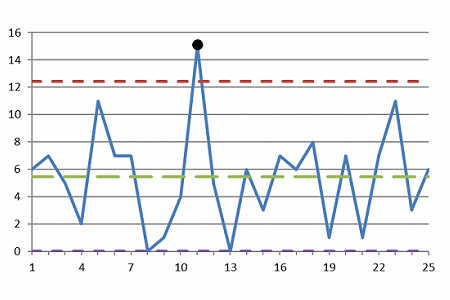
Figure 2: Control chart with an outlier
The control chart shown in Figure 2 has an outlier at Point 11.
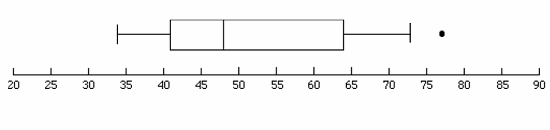
Figure 3: Box plot with an outlier
The box plot shown in Figure 3 has an outlier at value 76.5.
Figure 4 provides an example of complaints per month with threshold limits. The long dashed red line represents the threshold limit, with the outlier data point of 60 complaints included. The short dashed green line represents the threshold limit, with the outlier data point of 60 complaints excluded. The gap between the short dashed green line and the long dashed red line is what I refer to as bonus statistical tolerance. It should be evident that excluding the outlier data point provides a more meaningful control limit, a more conservative approach.
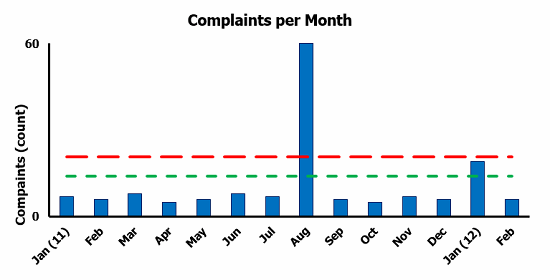
Figure 4: Complaints per month threshold limit example
Trends Help Identify Problems
The most important reason to use trending data is to detect when something has changed beyond the normal noise of the process. In the complaints per month threshold limit example in Figure 4, the short green dashed line represents the normal noise of the process. For the month of August, 60 complaints were filed. Because the 60 complaints exceeded the normal noise of the process, a CAPA would be opened in addition to the normal individual complaint investigation to identify the cause of the spike in complaints.
Another consideration would be how to “normalize” the data. For the example in Figure 4, the average number of complaints per month is approximately seven, with 1,000 units produced per month. If production was increased to 2,000 units per month, it would be reasonable to assume the number of complaints would double. That is why data normalization should be utilized. Some of the normalizing factors that I have seen include units sold, units shipped, and number of patients treated.
There is one more consideration for the complaints per month threshold limit example in Figure 4. There may be a lag of several weeks, or even several months, from the time the unit was produced until the complaint was received. The lag should be considered when investigating the cause of the complaint. It should be apparent there is no one perfect way to analyze data trends; however, for a trending program to be successful, consistency is important. Pick a method and stick with it.
Although the example provided here was for complaints, the concept can also be applied to nonconformances, internal and external audit findings, service reports, maintenance reports, etc. The use of trending is a great risk-based tool to trigger the CAPA process.
Conclusion
The discussion above focuses on data trending to aid the process of identifying and integrating risk management throughout the QMS. There are many more tools available to identify, analyze, mitigate, and monitor risk.
I want to reinforce that alert limits and action limits should be utilized based upon an organization’s risk acceptance determination threshold, industry practice, guidance documents, and regulatory requirements.
I cannot emphasize enough the importance documenting the tools and methods used. Best practice includes providing rationale for your organization’s use of risk tools and activities. The requirements and risk management tools presented in this article can and should be utilized based upon industry practice, guidance documents, and regulatory requirements.
This article series has introduced other methods for integrating risk management in the quality management system. Other articles in the series include:
- Integrating Risk Management In The Quality Management System — A Primer
- An Introduction To qFMEA – A Tool For QMS Risk Management
- Using Risk-Based Thinking To Manage Suppliers
References:
- Durivage, M.A., 2014, Practical Engineering, Process, and Reliability Statistics, Milwaukee, ASQ Quality Press
About the Author
 Mark Allen Durivage is the managing principal consultant at Quality Systems Compliance LLC and an author of several quality-related books. He earned a B.A.S. in computer aided machining from Siena Heights University and an M.S. in quality management from Eastern Michigan University. Durivage is an ASQ Fellow and holds several ASQ certifications, including CQM/OE, CRE, CQE, CQA, CHA, CBA, CPGP, CSQP, and CSSBB. He also is a Certified Tissue Bank Specialist (CTBS) and holds a Global Regulatory Affairs Certification (RAC). Durivage resides in Lambertville, Michigan. Please feel free to email him at mark.durivage@qscompliance.com with any questions or comments, or connect with him on LinkedIn.