
What Can We Learn From 2016 FDA & MHRA Drug GMP Inspection Observations?
By Barbara Unger, Unger Consulting Inc.
 A comprehensive GMP intelligence program includes monitoring of enforcement actions, including FDA form 483s, warning letters, recalls, import alerts, consent decree agreements, EU reports of GMDP noncompliance, and inspection summaries published by selected European health authorities. This article presents the most recent GMP inspection data from CDER and MHRA (Medicines and Healthcare Products Regulatory Agency). The CDER data and the MHRA data come from GMP inspections conducted in 2016.
The CDER drug inspection observations supplement the information we published in a previous article regarding CDER drug GMP warning letters from the same time interval. The analysis herein includes data from the FY2016 form 483 observations and compares results with those from the three previous fiscal years. Raw data comes from the FDA website, though it is presented in a different manner. For example, I have combined the frequencies of all observations that cite 21 CFR 211.192 into a single value. In the FDA data, there are multiple line items for 211.192, each with a different frequency. For example, in the FDA listing the most frequently cited item is 211.22(d), procedures not in writing, fully followed. When you combine the full collection of times that 211.192 and 211.42(c) are cited, however, they become tied for No. 1, with 211.22(d) becoming the third most frequent citation. FDA uses the term “frequency” which seems to be the number of times a given citation was identified in the form 483 collection supporting these data.
Only form 483s that were issued through the Turbo EIR (Establishment Inspection Report) system are considered in this data, which provides a distinct limitation. No form 483s issued to API manufacturers or issued outside of the Turbo EIR system are included. This becomes important to consider with FDA’s increased focus on API manufacturers, particularly outside the U.S. MHRA data is similar and only includes deficiencies identified at dosage form manufacturers. Note that the MHRA data includes only the 10 most frequently cited groups, whereas the data on the FDA website includes all observations.
Here are some highlights of the analysis:
- FDA
- The number of form 483s included in this analysis remains reasonably constant over the past four fiscal years even though it does not represent all drug inspections conducted by the FDA, particularly inspection of sites that manufacture APIs.
- Deficiencies in investigations remains at the top of this list over the past four years. We as an industry cannot seem to get this quite right.
- In general, the regulations cited and their relative order has remained reasonably constant over the past four fiscal years. Even though a few items have changed place, none of the numbers are striking.
- MHRA
- MHRA issued 143 “critical” deficiencies, in a total of 324 inspections of which 82 inspections (25 percent) were overseas inspections and 242 inspections (75 percent) were conducted in the U.K.
- The EU GMP Guide Chapters and Annexes that were cited in critical observations include, in order of their frequency: Chapter 1, Annex 1, Chapters 5, 8, Annex 15, Chapter 3, Annex 11, Chapter 2, Chapters 4 and 6.
- The MHRA cited a total of 4,588 deficiencies in the 10 areas that received the critical observations. Critical deficiencies constituted 3 percent of the total.
The sections that follow include more detailed discussion of the observations.
FDA Form 483 Inspection Observations
The following data is based on inspections generated using the FDA Turbo-EIR system. The number of form 483s remained quite similar over the four years in question, with FY2014 having the fewest. Form 483s issued to API manufacturers or issued outside of the Turbo EIR system are not included.
Table 1 shows only the most frequent group of inspection observations; the tabulation on the FDA website shows all observations. Table 1 is organized in the order of those observations with the highest to lowest frequency for 2016. In several instances, though, the order of the observations did change in FY2016 from previous years; these are highlighted in gray.
Table 1: Inspection Observations Issued Through Turbo-EIR System per Fiscal Year. (These are shown in the order of highest to lowest for FY2016.)
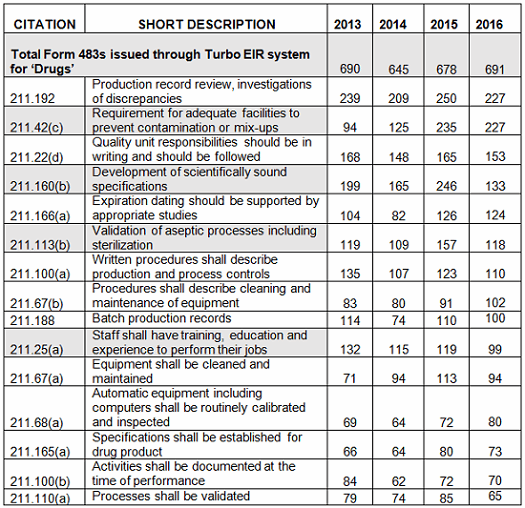
Figure 1 below shows the data from Table 1 graphed over four fiscal years, 2013–2016. While there is some variation from year to year, the frequency with which specific regulations are identified remains generally constant. Figure 2 shows additional detail of several of the areas where the frequency of the observation did show some variation between FY2015 and FY2016.

Figure 1: Frequency of observations
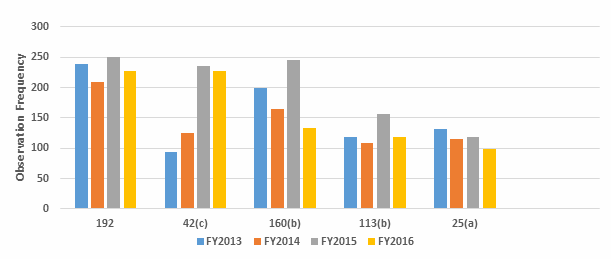
Figure 2: Selected observation frequency
In conclusion, there is little change in the overall frequency of inspection observations, as characterized by the regulation cited, between FY2013 and 2016. This may have been different if all inspected sites, including API sites, had been included in the metrics. The three most frequent observations in FY2016 cite 211.192 (investigations), 211.42(c) (design of facilities to prevent cross contamination), and 211.160(b) (scientifically sound specifications). While 211.192 was in first place for all four fiscal years, in 2016 it tied with 211.42(c), Requirement for adequate facilities to prevent contamination or mix-ups, moved up from third place, even though the actual number of those observations decreased from 2015. Citations against 211.160(b) Development of scientifically sound specifications went from second place to fourth place. Observations citing 211.113(b) Validation of aseptic processes including sterilization dropped from fifth place to sixth place in 2016, and the actual number decreased significantly, to FY2013 levels. Finally, observations identifying 211.25(a) Staff shall have training, education and experience to perform their jobs dropped from eighth place to 10th place in 2016.
MHRA Inspection Deficiencies
I won’t reproduce the graphics from the MHRA slide deck, but I do recommend reading those because they contain a wealth of information at a granular level. The MHRA conducted a total of 324 inspections in 2016; 242 inspections were conducted in the U.K. and 82 inspections were conducted overseas. The MHRA inspections identified 143 total “critical” deficiencies in 2016, a dramatic increase from 2015 when 51 were identified. We cannot compare this with the U.S. FDA inspection observations because the FDA does not classify the criticality of observations. In the future, perhaps health authorities will adopt a common classification category for inspection observations.
MHRA identified critical deficiencies in only five areas in 2015, and increased this to 10 areas in 2016. Several categories saw significant increases, for example:
- Sterility Assurance had no critical observations in 2015 and 34 in 2016
- Personnel had no critical observations in 2015 and eight in 2016
- Premises and Equipment had no critical observation in 2015 and nine in 2016
- Computerized Systems had one critical observation in 2015 and nine in 2016.
Table 2 identifies the areas with critical deficiencies identified in 2016. The groups included seven Chapters and three Annexes. Figure 3 clearly shows that approximately two-thirds of the deficiencies are included within three groups: Quality Systems, Sterility Assurance, and Production.
Table 2: Chapters and Annexes Associated with MHRA Critical GMP Inspection Deficiencies in 2016
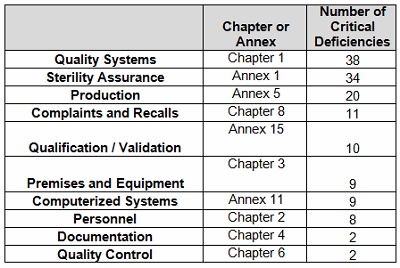
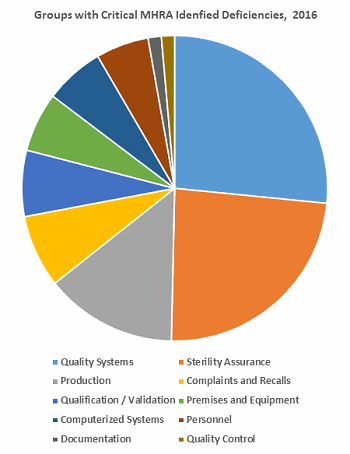
Figure 3: Distribution of these critical MHRA deficiencies
Conclusions
It is difficult to directly compare areas identified by the MHRA with those identified by the FDA, as the FDA does not categorize the criticality of inspection observations as do the MHRA and other health authorities. We can, however, say that with FDA observations addressing “investigations” at the top of the list, “quality unit responsibilities” third on the list, and “staff training” at No. 10, quality systems is a high priority for the FDA. Similarly, Quality Systems is the area with the most critical deficiencies identified by the MHRA in 2016. Validation of aseptic processing (21 CFR 211.113(b)) was sixth on the FDA list but was second on the list for MHRA.
Computer system requirements are identified in Annex 11, Computerized Systems. Data integrity and data governance deficiencies are identified by MHRA by citing either Chapter 4 or Annex 11, both of which were associated with critical deficiencies in 2016. Similar FDA regulations are found in 21 CFR 11, Electronic Records; Electronic Signatures, and it is rarely, if ever, identified in either form 483s or warning letters. The FDA frequently associates these types of inspection observations with predicate rules including 21 CFR 211.68(b) and 21 CFR 194.
MHRA has always had a reputation as one of the most rigorous health authority inspectorates. It seemed to have upped its game in 2016, as demonstrated by an increase in the number of critical deficiencies, along with an increase in the total number of deficiencies identified for essentially the same number of inspections.
Both agencies will likely continue to focus on sterility assurance, investigations, quality systems, and data integrity/governance in 2017. It would be interesting to see if the number and types of observations identified during API inspections were similar for the two health authorities. And finally, the Mutual Recognition Agreement (MRA) between FDA and the European Medicines Agency will likely not impact the number of inspections for 2017, though it may be possible to see that happen in 2018. Time will tell how this impacts the number and locations of both EMA and FDA inspections.
References:
About the Author:
 Barbara Unger formed Unger Consulting, Inc. in December 2014 to provide GMP auditing and regulatory intelligence services to the pharmaceutical industry, including auditing and remediation in the area of data management and data integrity. Her auditing experience includes leadership of the Amgen corporate GMP audit group for APIs and quality systems. She also developed, implemented, and maintained the GMP regulatory intelligence program for eight years at Amgen. This included surveillance, analysis, and communication of GMP related legislation, regulations, guidance, and industry compliance enforcement trends. Barbara was the first chairperson of the Rx-360 Monitoring and Reporting work group (2009 to 2014) that summarized and published relevant GMP and supply chain related laws, regulations, and guidance. She also served as the chairperson of the Midwest Discussion Group GMP-Intelligence sub-group from 2010 to 2014. Barbara is currently the co-lead of the Rx-360 Data Integrity Working Group.
Before Amgen, Barbara worked for the consulting firm Don Hill and Associates, providing regulatory and quality services to the pharmaceutical industry, and for Eli Lilly and Company in quality and CMC regulatory affairs positions. She began her career in the pharmaceutical / device industry with Hybritech Inc. and received a bachelor's degree in chemistry from the University of Illinois at Urbana-Champaign. You can contact Barbara at bwunger123@gmail.com.