
A Data-Derived Approach For Selecting Criticality Levels In FMECAs For Cleaning Process Risk Analysis
By Andrew Walsh; Thomas Altmann; Joshua Anthes; Ralph Basile; Alfredo Canhoto, Ph.D.; Stéphane Cousin; Delane Dale; Parth Desai; Boopathy Dhanapal, Ph.D.; Jayen Diyora; Christophe Gamblin; Igor Gorsky; Jove Graham; Benjamin Grosjean; Reto Luginbuehl; Spiro Megremis; Ovais Mohammad; Mariann Neverovitch; Rod Parker; Jeffrey Rufner; Siegfried Schmitt, Ph.D.; Osamu Shirokizawa; and Stephen Spiegelberg, Ph.D.

Part of the Cleaning Validation For The 21st Century series
The ASTM E55 Cleaning Team, in collaboration with F04 Medical Device Committee members, has begun development of a new Standard Practice Guide for using the quality risk management tools FMECA (failure modes, effects, and criticality analysis) and HACCP (hazard analysis and critical control points) to perform risk identification, risk analysis, and risk control on cleaning processes for pharmaceuticals/biopharmaceuticals and medical devices.1 During the process of developing this standard, the working group’s discussions became focused on how to set criticality levels for failure modes and defining what these levels should mean. The team felt that the commonly used three-level criticality system (1=Low, 2=Medium, 3=High) was inadequate for use in a science- and risk-based standard for cleaning process development, validation, and monitoring. This article will provide a detailed discussion of how science-based and data-driven criticality levels were derived, the meaning of each level, and how they can be used for guiding the selection of risk reduction and risk control measures.
The already well-established and used ASTM E3106 Standard Guide2 requires a review of cleaning procedures to identify potential hazards under the risk (hazard) identification step (Figure 1). Ideally, during development and before use, cleaning procedures should be analyzed using a risk assessment tool to minimize the chance of failure, improve the cleaning procedures, and make them more reliable and robust.3 Legacy cleaning procedures should also be subjected to risk assessments to minimize the likelihood of cleaning failures, including review of legacy cleaning data.
 Figure 1: Cleaning Risk Management Process of ASTM E3106
This new standard will describe how the risk management tools FMECA and HACCP can be combined and used to review procedural hazards. Any procedural steps identified as hazards should then be analyzed, and hazard/risk elimination or remediation steps should be scheduled based on the level of risk. In this new standard, the level of risk and the hazard/risk elimination steps or remediation steps will be based on the criticality level.
FMEA/FMECA
The FMEA (failure modes and effects analysis) and the FMECA are two of the most commonly used tools for risk assessment in many industries (e.g., automotive, aviation) and are now widely used in the pharmaceutical industry. The FMEA is considered a systematic and comprehensive tool for performing risk analysis and has also been adapted for evaluating processes, so it fits well into the risk analysis of cleaning processes. The FMEA was developed by the U.S. military shortly after World War II and published as MIL-P-1629A.4 It was adopted for use by NASA and the aviation industry in the early 1960s, then in the 1970s by the automotive industry. It was adopted later by many other industries, eventually making its way into international standards such as ASTM and ISO, but only in recent years has it been implemented in the pharmaceutical industry.
Both FMEA and FMECA can be powerful tools for performing risk analysis and their use fits well into cleaning validation. FMECAs are distinguished from FMEAs by incorporating specifications into the risk analysis. The use of specifications allows a failure mode to be classified as critical (to a specification) or not critical. For example, limits derived from health based exposure limits (HBELs) could be used as one of the specifications.
FMEAs typically use three criteria in their evaluation of failure modes or hazards that fit well in the ICH Q9 definition of risk:
- S - Severity (of the hazard)
- O - Likelihood/probability of occurrence (of the hazard)
- D - Detectability (of the hazard)
These criteria are normally evaluated using ordinal scales ranging from 1 to 10, 1 to 5, 1to 3 (Low/Medium/High), or other combinations. Values determined for severity, occurrence (likelihood), and detectability can be used to generate a risk priority number (RPN) that is often displayed in a color-coded risk matrix table. Typically, the RPN is the product of these values.
RPN = S x O x D
This RPN is then used to rank the failures and prioritize them for any needed actions, based on the criticality scales selected. Many organizations have struggled to establish defined and clear meanings for the values of these scales as they tend to be arbitrary and subjective and too generic for use in many pharmaceutical situations. In addition, the RPN has been shown to be a mathematically incorrect calculation that yields biased values and can result in values that have wide variations in the level of risk.5 Despite this shortcoming, the RPN continues to be widely used. The unreliability of these scales and the RPN calculation directly and negatively impacts the determination of criticality. The subjectivity of the FMEA scales typically used, and the lack of a scientific/statistical basis for their RPN numbers,5 makes these scales and their RPNs inappropriate for use in the pharmaceutical industry. Consequently, these scales as they exist, and the RPN numbers derived from them, cannot be used to determine the criticality of a failure mode in pharmaceutical or medical device cleaning. It should be noted that the ICH (International Conference on Harmonization) has recently issued a new revision to the ICH Q9 Quality Risk Management Guideline attempting to encourage the industry’s use of these QRM tools toward the use of “scientific knowledge and ultimately link to the protection of the patient.”
Cleaning FMEA/FMECA
If pharmaceutical and medical device manufacturing is to advance to a science- and risk-based approach to cleaning, the scales for severity, occurrence, and detectability used in FMEAs for cleaning must be justified using scientific principles, process knowledge, and statistics. There is a variety of information associated with cleaning that might be considered to evaluate the severity, occurrence (likelihood), and detectability criteria and create scientifically derived and objective scales. Table 1 lists some information that might be considered during an FMEA/FMECA.
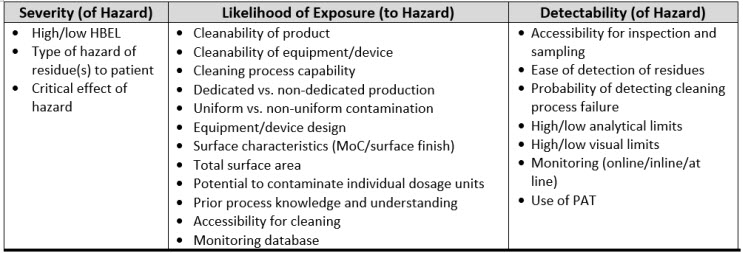 Table 1: Examples of Cleaning Information That Can Be Used For The Cleaning FMEA
Any scales used should be derived from, and based on, empirical data. Such data exist for cleaning or are obtainable from pharmaceutical and medical device manufacturing. In fact, quantitative scales have already been developed that can be used to assign scores that are based on data and are not subjective.6-9 For cleaning, the traditional FMEA scales can be substituted with these scales as described in ASTM E3106.
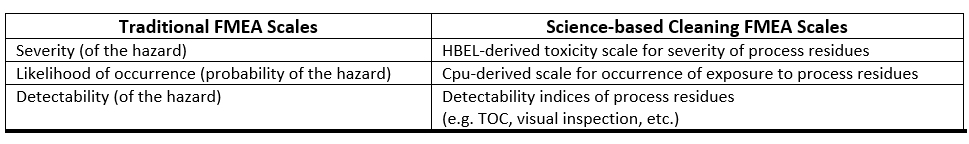 Table 2: Comparison of Traditional FMEA Scales to Cleaning FMEA Scales
For example, in a cleaning process, if a failure mode could result in unacceptable residues of an API remaining on equipment, then the HBEL-derived toxicity score of that API would replace the severity score. Furthermore, if the process capability of the cleaning process is known, then its process capability indexupper (Cpu) derived score would replace the occurrence score (as the cleaning process effectiveness and the probability of residues being present are known). Finally, if the visual detectability index, the total organic carbon (TOC) detectability index, or other such indices are known, one or more of these would replace the detectability score (see Figure 2). Since these scores are derived directly from empirical data, their values are specific and objective and not arbitrary or subjective.
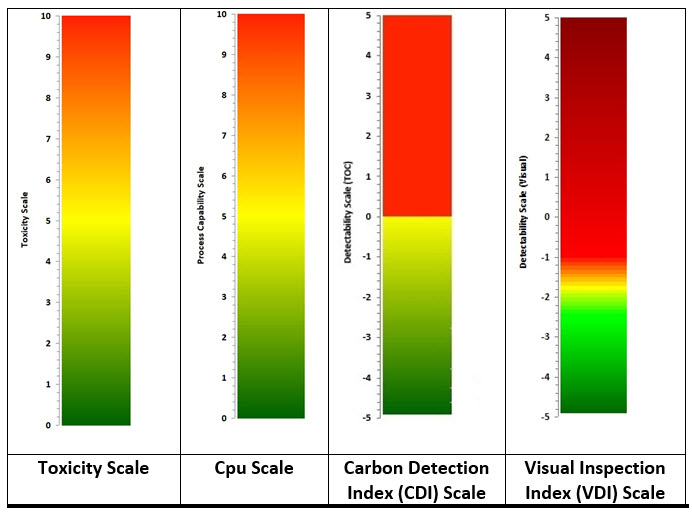
Figure 2: Data-derived Scales for use in FMEA/FMECA – Values for the scales are calculated as shown below. See their references for detailed information.
Toxicity Score6 = -Log (HBELgrams)
Cpu Score7 = 1/Cpu x 10
CDI8 = Log (Detection LimitTOC / Swab LimitTOC
VDI9 = Log (Visual Residue Limit / Maximum Safe Surface Residue)
Determining Criticality
Criticality analysis (CA) ranks each potential failure mode identified in the FMECA according to its severity classification and its probability of occurrence, based upon the best available data.4 There are two ways this can be done:
- Criticality number (qualitative, semi-quantitative, or quantitative)
- Criticality matrix (qualitative, semi-quantitative, or quantitative)
Calculating a criticality number is best done using actual failure data. One approach is to use the potential failures from sigma levels as shown in Table 3. When the process capability (Cpu) of a cleaning process is known, a criticality level can be easily assigned.
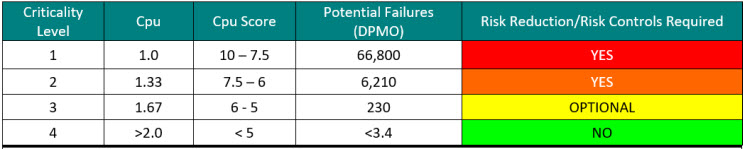 Table 3: Criticality Levels Set Using Sigma Values – Note: the DPMO shown assumes a 1.5 sigma shift commonly used in Six Sigma/operational excellence programs to account for long-term dynamic mean variation.10 While there is debate within the Six Sigma community about the appropriateness of using this 1.5 sigma shift on processes that are very well controlled, it is recommended to use these values until the cleaning processes are well characterized.
However, there are several situations in which failure data are not available. An example might be a legacy product where insufficient swab testing was performed to determine the likelihood of a cleaning failure. Also, new products manufactured in new equipment may have no cleaning qualification or verification data yet to determine the likelihood of a cleaning failure. In these cases, the failure modes can be assessed for likelihood and severity, with the likelihood of a cleaning failure being evaluated probabilistically. These calculations may use substituted numbers (e.g., swab data from similar cleaning processes). This would be a “qualitative” criticality analysis. When process-specific data become available, then the actual data would be used to recalculate the criticality number. This would then become a “quantitative” criticality analysis.
An alternative approach is to use a criticality matrix.4 A criticality matrix creates a two-dimensional visual representation of failure modes based on their likelihood and severity and can use either quantitative or qualitative data. Such a criticality matrix has already been defined using the process capability score of the cleaning process and the toxicity score of the compound being cleaned, and this arrangement is called the Shirokizawa matrix.11 The Shirokizawa matrix has many possible applications in cleaning, from guiding risk-based control strategies to risk-based method selection (See Figure 3).
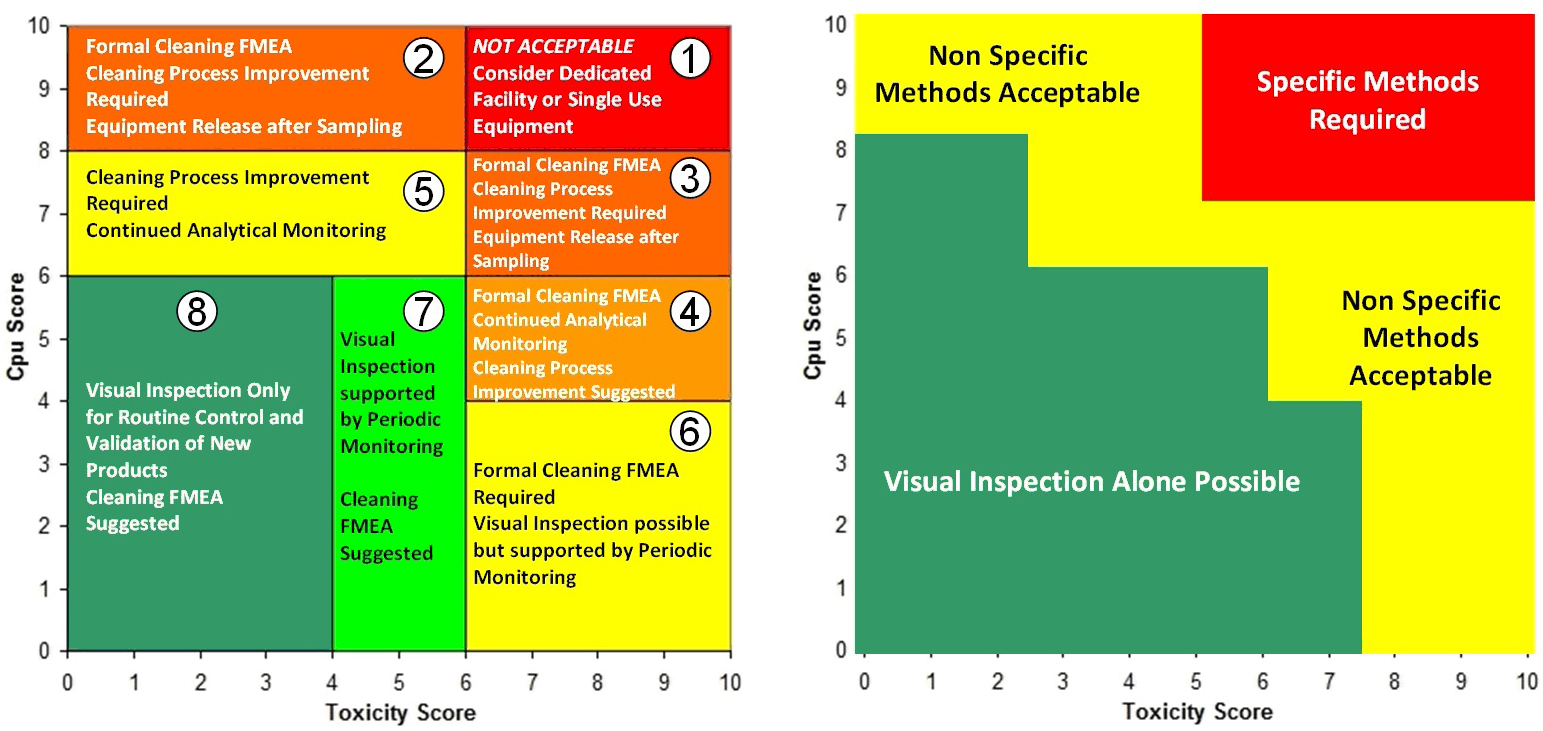
Figure 3: Two Examples of the Shirokizawa Matrix from ASTM E31062 – The example on the left shows the Shirokizawa matrix used for the selection of a cleaning control strategy.11 The matrix is broken into eight areas based on the toxicity and process capability scores of the compound being evaluated. The example on the right shows the specific or non-specific methods selected based on toxicity score and Cpu Score. This matrix can be used as a visual guide to assist in the risk-based selection of methods. Click on the figure image to enlarge.
One weakness with the examples in Figure 3 is that the boundaries between the different sections were not selected using a clear scientific or statistical basis. For example, in the Shirokizawa Matrix on the left, it was felt that there needed to be distinctions made between high-hazard compounds and low-hazard compounds and between poor cleaning processes and good cleaning processes. A line was drawn at the toxicity score of 6, which separated the matrix into four more restrictive sections (1, 3, 4, and 6) and four less restrictive sections (2, 5, 7, and 8). Similarly, a line at the Cpu scores of 8 separated the highest restrictive sections (1 and 2) from less restrictive sections (3 and 5) and a line at the Cpu score of 6 separated the less restrictive sections from the least restrictive sections (4, 6, 7, and 8). This resulted in eight sections that were essentially chosen somewhat arbitrarily. These boundaries were chosen based on the opinions of the authors of the E3106 on what toxicity score or Cpu score had a high enough or low enough score to warrant a change in control strategy or method selection. However, it should be expected that in a science-based, risk-based, and statistics-based standard, such decisions should not be based on arbitrary values.
If we apply the Six Sigma values from Table 3 to the criticality levels, this will yield a Shirokizawa matrix with four criticality zones as shown in Figure 4.

Figure 4: Shirokizawa Diagram for Selecting Criticality based on Table 3.
These four criticality zones would be derived from statistically based failure rates and would therefore be risk-based and not arbitrarily chosen. While this was an improvement, the ASTM Cleaning Team also decided that there should be some difference in risk reduction activities and risk controls between compounds with low toxicity and those with high toxicity for each of the criticality zones. So, it was decided to add a transition point at a toxicity score of 5 to separate these criticality zones into low toxicity areas and high toxicity areas where the levels of risk reduction and risk controls could then be based on the toxicity level of the compound (Figure 5).

Figure 5: Shirokizawa Diagram for Selecting Criticality with a Transition Point at the Toxicity Score of 5.
There were then further discussions around assigning the toxicity score of 5 for the transition point simply because it is the midpoint on the toxicity scale. The question that arose was whether the toxicity score of 5 was truly representative of the midpoint of the actual HBEL population.
The ASTM cleaning team decided to address this by, in part, performing a survey to understand what the current distribution of HBELs and their toxicity scores looked like. Several sources of HBELs were contacted, and 3,586 HBELs were obtained and their toxicity scores were calculated from these HBELs. The distribution of the toxicity scores was then statistically analyzed using Minitab statistical software. However, it was realized that a significant number of the compounds analyzed might be duplicates, as they came from multiple sources, and this could bias the results. The 3,586 HBELs were examined, and all duplicates were removed, which resulted in a final list of 2,889 HBELs. It should be noted that this is a very significant sample size for this kind of survey, as it represents approximately 18% (2,889/16,57912) to 38% (2,889/7,50013) of all approved medications in the United States. Interestingly, the interquartile ranges of these two data sets only changed slightly (Table 4), indicating that these toxicity scores are likely to accurately reflect the midpoint of the HBEL data and we could proceed comfortably with the statistical analysis.
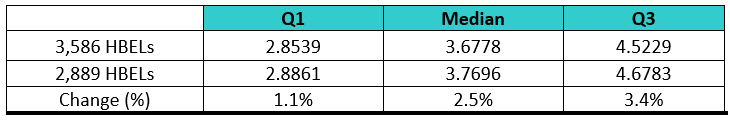 Table 4: Comparison of the Interquartile Ranges for the Two Sets of Data
The Summary Report for the analysis of the toxicity scores derived from the 2,889 HBELs is shown in Figure 6.
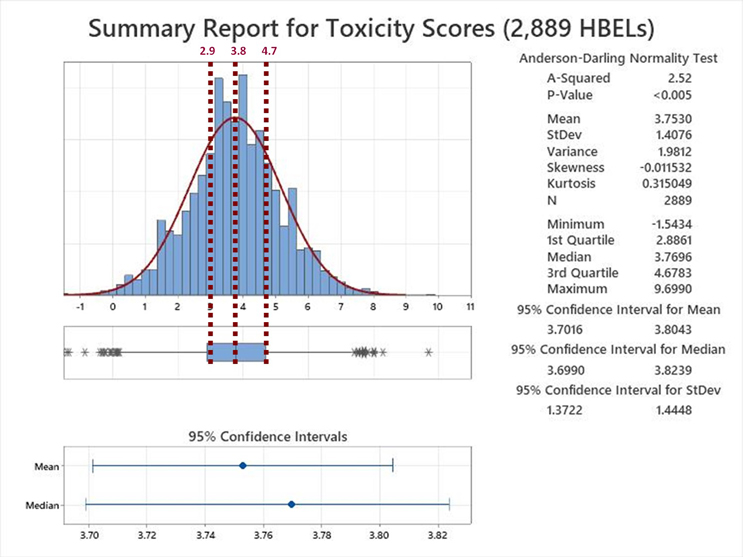
Figure 6: Summary Report for the Toxicity Scores of 2,889 HBELs – These HBEL data were supplied by Affygility Solutions (2,637), Dr. Ester Lovsin-Barle (162), and Dr. Andreas Flueckiger (90). Reference lines have been added at the Q1, Median and Q3 of the interquartile range of these toxicity scores. NOTE: The asterisks at both ends of the box and whisker plot indicate outliers.
Examination of the Summary Report revealed that the toxicity scores of the HBELs appeared normally distributed, as the mean (3.75) and median (3.77) were almost identical. The team decided to use the interquartile range (the region where 50% of the data are found) to set the zones where a decision to move the compound either up to zone A or down to zone B would be. Therefore, instead of a transition point at a toxicity score of 3.8, toxicity scores between 2.9 and 4.7 would be either moved up to A or down to B. This decision should be based on an evaluation by the cleaning validation subject matter expert/cleaning process owner (e.g., with input from environmental health and safety, technical, and quality organizations) of the HBEL monographs, in particular, regarding their hazard identification and their critical effect(s) such as: Is the compound a genotoxicant, carcinogen, reproductive developmental toxicant, and/or has a highly sensitizing potential?14 It is important to understand that the HBEL monograph is not just a number but a risk assessment and the cleaning validation subject matter expert/cleaning process owner should be aware of all the safety issues with each of the drugs in their facility and use this information to adopt appropriate risk reduction actions and risk controls.
In addition to this, the four criticality levels based on Cpu shown in Table 4 could now be broken into eight criticality levels to account for the two toxicity zones (A & B) as shown in Table 5.
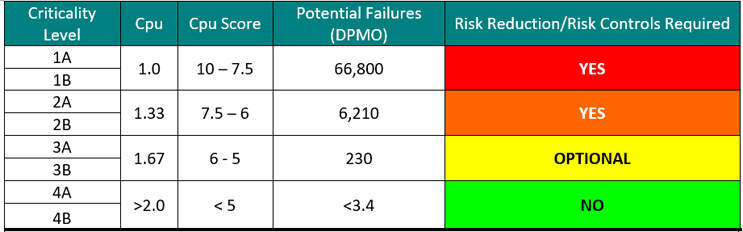 Table 5: Criticality Levels Set Using Sigma Values
Based on this statistical analysis and the criticality levels in Table 5, the ASTM Cleaning Team came up with the criticality matrix shown in Figure 7.
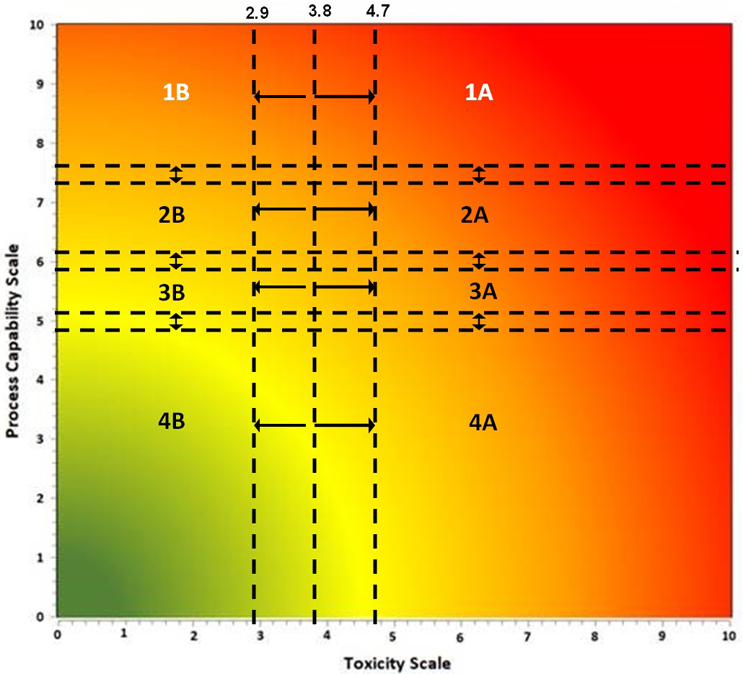
There are also transition zones between each of the four levels. The decision to move a compound up a level or down a level should be based on an examination of the data supporting the Cpu value. A Cpu score that is based on a small data set of swab samples and/or few qualification runs might be moved up a level, whereas a Cpu score that is based on an extensive data set of swab samples and/or multiple qualification runs might be moved down a level. The statistical significance of the data is also important to evaluate. For example, a small data set with a power value of 1 may be considered adequate, whereas a large data set with a power value of 0.5 may not be considered adequate.
Determining Risk Reduction/Mitigation Actions
Risk reduction and risk control strategies can be developed using the science- and statistics-based scores of the Shirokizawa matrix as shown in Table 6. The recommended strategies indicated in each category are based on the ICH Q9(R1) primary principle that the “level of effort, formality and documentation of the quality risk management process should be commensurate with the level of risk.”

Risk reduction actions would most likely include cleaning process improvement activities (ASTM G122), as in the criticality zones 1A to 2B the potential for cleaning failures is quite high and this would definitely require improvements to the cleaning process. In some cases, degradation or denaturation steps may alleviate the risk, as these steps could eliminate the failures by destroying the hazard. Hazard replacement might include changing to a less hazardous cleaning agent. A redesign of legacy equipment can improve the cleaning process substantially. There is a new ASTM Standard in development (WK78595 Clean by Design15) that can be applied to make equipment more cleanable. Improving method detection and/or switching to a specific method may only address the inability to evaluate the risk adequately. Ultimately, if no risk reductions are successful, equipment dedication or single-use equipment may be the only mitigation actions left.
Determining Risk Controls
Risk controls are most likely to also follow principle number 2 in ICH Q9(R1) that “the level of effort, formality and documentation of the quality risk management process should be commensurate with the level of risk.” Risk controls would vary substantially based on the criticality levels. As the risk increases more and more controls and their frequency should increase.
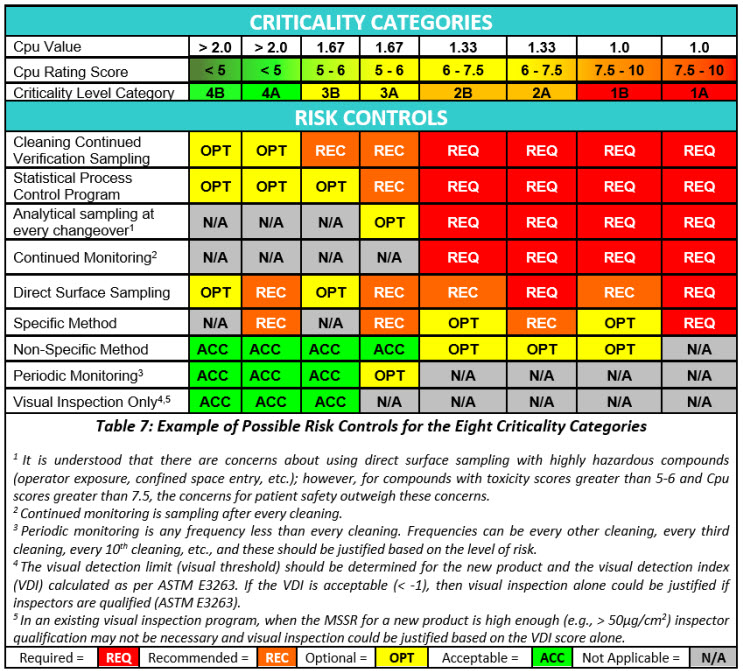
Risk controls will primarily be based on monitoring and the intensity of monitoring, ranging from analytical testing after each cleaning process to visual inspection. At the highest levels of risk, monitoring may be analytical testing after each cleaning process using specific methods combined with statistical process control (SPC) and real-time trend analysis to prevent failures. At the lowest levels of risk, monitoring may be accomplished through visual inspection by qualified operators/inspectors with no SPC and or trend analysis being performed.
Summary
The authors (ASTM Cleaning Standards Team) believe the Shirokizawa criticality matrix and the risk reduction and risk control tables derived from the Shirokizawa criticality matrix described in this article are a significant step forward in the science-based, risk-based, and statistics-based initiatives of the E55 ASTM Pharmaceutical Standards for cleaning. The authors also believe that this approach fits perfectly with the intent of the recently issued ICH Q9 (R1).
The contents of this article will be part of the basis for the ASTM Work Item WK85802 “Standard Guide for Using FMECA and HACCP for Performing Risk Identification, Risk Analysis & Risk Control on Cleaning Processes for Pharmaceuticals and Medical Devices.”
Peer Review
The authors wish to thank David Dolan, Ph.D., Mallory DeGennaro, Kenneth Farrugia, Andreas Flueckiger, MD, Ioanna-Maria Gerostathi, Ioana Gheorghiev, MD, Miquel Romero Obon, Laurence O'Leary, Ajay Kumar Raghuwanshi, and Joel Young for reviewing this article and for providing insightful comments and helpful suggestions.
References
- American Society for Testing and Materials Work Item WK85802 "Standard Guide for Using FMECA and HACCP for Performing Risk Identification, Risk Analysis & Risk Control on Cleaning Processes for Pharmaceuticals and Medical Devices," www.astm.org/workitem-wk85802
- American Society for Testing and Materials E3106-22 "Standard Guide for Science Based and Risk Based Cleaning Process Development and Validation" www.astm.org/e3106-22.html
- Walsh, A., Altmann, T., Canhoto, A., Barle, E. L., Dolan, D., G., Flueckiger, A., Gorsky, I., Graham, J., Kowal, R., Neverovitch, M., Ovais, M., Shirokizawa, O., and Waldron, K., “Measuring Risk in Cleaning: Cleaning FMEA and the Cleaning Risk Dashboard,” Pharmaceutical Online, April 2018.
- MIL-STD-1629A, Military Standard: Procedures For Performing A Failure Mode, Effects, And Criticality Analysis (24 Nov 1980)
- Wheeler, D., “Problems with Risk Priority Numbers – Avoiding More Numerical Jabberwocky,” Quality Digest, June 2011, www.qualitydigest.com/inside/quality-insider-article/problems-risk-priority-numbers.html
- Walsh, A., Crevoisier, M., Barle, E. L. Flueckiger, A., Dolan, D. G., Ovais, M., Shirokizawa, O., and Waldron, K., “An ADE-Derived Scale for Assessing the Risk of Compound Carryover in Shared Facilities,” Pharmaceutical Online, May 22, 2017.
- Walsh, A., Barle, E. L., Dolan, D. G., Flueckiger, A., Gorsky, I., Kowal, R., Ovais, M., Shirokizawa, O., and Waldron, K., “A Process Capability-Derived Scale for Assessing the Risk of Compound Carryover in Shared Facilities,” Pharmaceutical Online, August 2017.
- Walsh, A., Altmann, T., Canhoto, A. Barle, E. L., Dolan, D. G., Flueckiger, A., Gorsky, I., Kowal, R., Neverovitch, M., Ovais, M., Shirokizawa, O., and Waldron, K., “A Swab Limit-Derived Scale for Assessing the Detectability of Total Organic Carbon Analysis,” Pharmaceutical Online, January 2018.
- Walsh, A., Altmann, T., Canhoto, A., Barle, E. L., Dolan, D. G., Flueckiger, A., Gorsky, I., Kowal, R., Neverovitch, M., Ovais, M., Shirokizawa, O., and Waldron, K., “An MSSR-Derived Scale for Assessing the Detectability of Visual Inspection,” Pharmaceutical Online, December 2017.
- Mikel J. Harry and J. Ronald Lawson, “Six Sigma Producibility Analysis and Process Characterization,” Addison-Wesley; 1st edition (January 1, 1992)
- Walsh, Andrew, Thomas Altmann, Ralph Basile, Joel Bercu, Ph.D., Alfredo Canhoto, Ph.D., David G. Dolan Ph.D., Pernille Damkjaer, Andreas Flueckiger, M.D., Igor Gorsky, Jessica Graham, Ph.D., Ester Lovsin Barle, Ph.D., Ovais Mohammad, Mariann Neverovitch, Siegfried Schmitt, Ph.D. and Osamu Shirokizawa "The Shirokizawa Matrix: Determining the Level of Effort, Formality and Documentation in Cleaning Validation" Pharmaceutical Online December, 2019
- Drug Bank Online; https://go.drugbank.com/stats
- Martindale: The Complete Drug Reference. https://www.pharmaceuticalpress.com/products/martindale-the-complete-drug-reference/
- European Medicines Agency “Guideline on setting health based exposure limits for use in risk identification in the manufacture of different medicinal products in shared facilities,” 01 June 2015, EMA/CHMP/CVMP/SWP/169430/2012
- American Society for Testing and Materials Work Item WK78595 “New Guide for the Design of Clean in Place-Friendly Equipment for Pharmaceutical and Biopharmaceutical Applications (CbD Clean by Design),” www.astm.org/workitem-wk78595