
A Framework For Measuring Training ROI Using Quality Metrics
By Vincent Rubino

Because a training program is a compliance requirement for GMP operations, similar to the compliance requirement to have a QA organization, it is typically considered part of the cost of quality for regulated operations. But, the requirement to have a training program is more than a means to assure compliance; it is an opportunity for companies to increase profits and reduce costs. These avoidable costs are referred to as the cost of poor quality (CoPQ).
A training program cannot replace formal education for basic science and language skills necessary in the GMP workplace. A training program supports, but cannot replace, operation procedures written by experts. As such, primary purposes of training are to provide a positive influence on company culture, maximize performance potential, and ensure workplace integrity. However, even though a training program exists, culture indicators may not be established or measured.
A question many company leaders ask is, “What is the impact of our training program on our bottom line?” This fundamentally important question is challenging to answer. The idea that a GMP training program can increase profits may seem counterintuitive, as the program is usually a cost center and not a source of tuition revenue. But savvy managers identify, understand, and support the drivers of value in business, and they expect a training program to support these value drivers.
Training effectiveness is challenging to measure. Intuition or judgment is commonly applied to examine the problems and opportunities associated with employee learning. This two-part article proposes an approach using data-driven insights from standard quality culture and performance metrics, with CoPQ calculations, to measure training return on investment (ROI). Calculation of ROI answers the question, “Is this investment worth the expense?” It measures how much money is earned or lost from investment in training and the impact of training on the bottom line.
How To Measure Training ROI When There Is No Tuition Revenue
ROI is measured in units of money and calculates the percentage increase or decrease in the value of the investment during a fiscal year, as shown in Equation 1.

- Benefits of training are calculated from monetary impact of improvements to manufacturing and services. Increases in benefits increase the ROI. This value is sometimes referred to as training effectiveness.
- Cost of training is calculated from the training budget. Cost savings increase the ROI. This can be referred to as training efficiency.
There are inherent challenges to accurately measuring knowledge gain, and program effectiveness often relies on qualitative ratings by supervisors who may be influenced by factors that are irrelevant to the training program. A common model for assessing trainees and evaluating training program performance is a simple and practical approach developed by Donald Kirkpatrick based on four measurement levels:
Level 1: Reaction. How did trainees react to the training session?
Level 2: Learning. What did trainees learn from the training session?
Level 3: Behavior. Do trainees use their new skills, knowledge, and attitudes on the job?
Level 4: Results. How did the training benefit the organization?
Generally, the higher the level, the more difficult and sophisticated the measurements are (Figure 1). While trainee satisfaction could be measured using a yes or no answer, measuring impacted business goals is more elusive. The Kirkpatrick measurement results can be used to support training ROI results. When the design is effective, training results and ROI improve in tandem.

Figure 1: Kirkpatrick training measures and ROI
Level 1 measurements include trainee self-assessments, sometimes scored as “smile charts,” which quantify how learners felt about the training program and its usefulness to them.
Level 2 measurements include graded exams, demonstrations, case studies, online testing, games, and role playing using scenarios.
Level 3 measurements include observations and appraisals from supervisors and customers and performance evaluations with measurable goals.
Level 4 measurements include KPIs and metrics for company goals. These include value drivers such as increased profits, reduced turnaround time and costs, customer and employee retention, accreditation, and innovation. Level 4 measurements are critical to the ability to calculate ROI. Level 4 measures how a clearly aligned training program positively impacts business objectives. Ensuring alignment exists and is measurable requires careful consideration. Training effectiveness is challenging to measure due to its intangible impacts on customer and employee satisfaction. Stakeholders do not always agree and understand if, and how, intangible improvements increase manufacturing opportunities and reduce the portion of unrealized revenue (recoverable revenue) resulting from quality issues, employee and customer turnover, and other factors. Many organizations find this topic too difficult to approach.
When leaders ask about training ROI, they are trying to understand something more difficult to measure than managing a training budget and training work efficiency. Leaders want to know how the training investment is helping to build revenue capabilities and avoid or manage costs of doing business. Those regulated by the FDA have new opportunities to better understand and measure training effectiveness ROI.
Recent History Of Pharmaceutical Quality Metrics
In 2002, the Pharmaceutical Manufacturing Research Project (PMRP) was established to work with the FDA to investigate the effects of factors such as company experience and organizational structure on the FDA’s enforcement efforts. The goal was to generate insights into strategic management of pharmaceutical manufacturing, including improvements to product and safety. The project collected data from dozens of pharmaceutical manufacturing facilities encompassing numerous factors and metrics including human resource management and training, performance metrics, and regulatory performance. The data was used to create a final benchmarking report in 2005.
The PMRP effort was a milestone in the development of metric standardization for the pharmaceutical industry. Of particular note, the PMRP observed benefits to companies with superior regulatory compliance including improved process efficiency, decreased investigation efforts and risks, and increased customer satisfaction. Unsurprisingly, better employee training was found to increase manufacturing performance and decrease the number of deviations.
At the 2011 Pharmaceutical Quality System (ICH Q10) Conference, PMRP, the Parenteral Drug Association (PDA), and the International Society for Pharmaceutical Engineering (ISPE) presented a business case which included CoPQ data from more than 60 companies. Among other benchmark calculations, it estimated the cost of one simple failure investigation at $10,000 to $100,000, with complex failures costing up to $1 million.
In 2012, the FDA enabled the establishment of criteria for it to perform risk-based inspections by adopting Title VII, Sections 705 and 706 of the FDA Safety and Innovation Act (FDASIA). In some cases, the FDA could decide to review requested documents instead of performing an on-site inspection. The FDA Drug Shortages Task Force requested assistance from the industry in developing a strategic plan and quality metrics to prevent drug shortages. The strategy of using a risk-based inspection approach and metrics provided by manufacturers was established. Industry organizations such as PDA, ISPE, and PhRMA developed proposals for metrics in tandem with the FDA. In 2015, the FDA provided its first draft of Submission of Quality Metrics Data Guidance for Industry describing the metrics it would like to evaluate, and ISPE published its Quality Metrics Initiative report (Wave 1). The following year, the FDA revised its Submission of Quality Metrics Data Guidance for Industry while ISPE published a Quality Metrics Initiative follow-up report (Wave 2).
The ISPE Wave 1 pilot study was designed to define and operationalize standard metrics for reporting to the FDA. Wave 2 expanded the data set, tested proposed metrics, and evaluated trends and effort expended by companies to gather the metrics data. They reported statistically verified metrics using a standardized process tested by the industry. The reports describe metric tools that can be used as is or adapted as needed.
Key findings of the ISPE Quality Metrics Initiative included:
- It is feasible to collect and submit a standardized set of metrics.
- A majority of companies report a benefit to benchmarking against data from their peers.
- Quality culture is important and has a significant relationship to key measures of performance.
With the understanding that good training improves quality and quality metric results, the next step is to put the FDA’s effort to use in measuring the value of training.
Connecting The Dots — Quality Metrics And Training ROI
As shown in Figure 2, a design and testing-style approach leading to calculation of training program ROI includes the following steps:
- Define the business (quality) outcomes that impact revenue and ROI.
- Define the necessary results (metrics) for business impact. Ensure these are aligned with the business outcomes.
- Establish performance (behavior) expectations. Ensure these are aligned with the business outcomes and metrics.
- Establish training curricula that meet trainee preferences and support business outcomes and performance expectations.
- Conduct the training, perform evaluations, collect and report metrics, and measure ROI. During this execution phase, refine the design as needed.
Training departments may face difficulty in defining and measuring business alignment and training program impact (Kirkpatrick Level 4), and it is here that the ISPE Quality Metrics Initiative can provide clarity. The initiative offers predefined business (quality) outcomes and metrics. In this example, we use them to establish a framework for calculating training ROI. The initiative offers a standard set of metrics that has been established and demonstrated as viable. For companies that use these metrics, there are opportunities for training departments to better understand their performance and identify areas for improvement. The ISPE effort, which included participation by the FDA, adopted metrics provided in the 2016 FDA draft metrics guidance. The FDA guidance metrics are not mandated; companies are free to choose which metrics they want to use and adjust them to benefit the company.
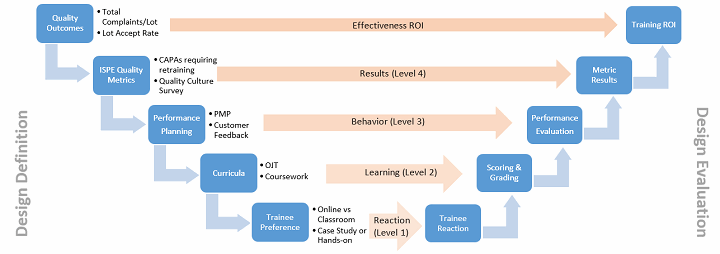
Figure 2: Definition and evaluation of training effectiveness
Quality Culture Indicators And Training ROI
Working in consultation with the FDA, the ISPE Quality Metrics Initiative established leading quality indicators that can be trended to predict quality outcomes impacting business results. One of these indicators is the standardized Quality Culture Evaluation, which is included as an appendix in the Wave reports. This survey is completed by company staff at all levels in the organization to quantify organizational capabilities, governance, leadership, mind-set, and integrity. The Quality Culture Evaluation is self-reported, and the results have been demonstrated to be statistically significant to internal and external quality outcomes that impact recoverable revenue (money which is otherwise wasted or lost) such as deviations recurrence and right first time, as well as business outcomes such as critical complaints and product recalls. CoPQ can be calculated based on performance metrics including Quality Culture Evaluation results.
Part 2 demonstrates how to apply quality metrics-based ROI calculations to set and achieve goals that meet specific business objectives.
 About The Author:
Vincent Rubino has worked in regulated healthcare testing and manufacturing since 2000, including roles in engineering, validation, quality, and business development. He began his career with a bioengineering degree from the University of California, Berkeley and now lives and works in South Korea.