
An MSSR-Derived Scale For Assessing Detectability Of Visual Inspection
By Andrew Walsh; Thomas Altmann; Alfredo Canhoto, Ph.D.; Ester Lovsin Barle, Ph.D.; David G. Dolan, Ph.D.; Andreas Flueckiger, M.D.; Igor Gorsky; Robert Kowal; Mariann Neverovitch; Mohammad Ovais; Osamu Shirokizawa; and Kelly Waldron
 Part of the Cleaning Validation For the 21st Century series
Two previous articles discussed how the acceptable daily exposure (ADE) of a compound and the process capability (Cpu) of its cleaning process can be used to assess the level of risk associated with cross contamination in shared facilities.1,2 This article will discuss how the maximum safe surface residue (MSSR) can be combined with the visual residue limit (VRL) to assess the acceptability of visual inspection for detecting the possibility of compound carryover in shared facilities. Combined with the ADE-derived toxicity scale1 and Cpu-derived probability scale,2 this new detectability scale can provide for a total measure of risk, and this new scale can also assist in determining whether visual inspection is acceptable for use in cleaning validation or verification.
Selection Of Analytical Methods In Cleaning
The analytical methods typically used in cleaning validation fall into two broad categories: specific methods and nonspecific methods. The decision to use a specific or nonspecific method should be science- and risk-based. For example, total organic carbon analysis (TOC) has been a method of choice for proteins due to its ease of use, the high carbon content of proteins, and the physiochemical difficulties in using specific methods such as enzyme-linked immunosorbent assay (ELISA).
In general, visual inspection would be considered a foundation method, and therefore always required. It would be supported next by TOC, conductivity, and other nonspecific methods or by more specific methods as necessitated by the risk level. Figure 1 illustrates this risk-based hierarchy of analytical methods. Particularly for low-risk situations (e.g., low-hazard compounds and easily inspected equipment), visual inspection could be the sole method used for release of equipment after cleaning for return to manufacturing (which it typically is after successful cleaning validation studies). Visual inspection can also complement other methods such as TOC or conductivity to provide additional documentation for the release of equipment after cleaning. Finally, in high-risk situations, specific methods such as HPLC, LC/MS, etc., may need to be used along with, as always, a visual inspection.
Figure 1 presents a hierarchy for selecting analytical methods for cleaning based on the ADE-derived toxicity scale.1 As the level of the hazard increases, the rigor required of the analytical method should increase. However, as indicated by the question marks, the transitions from using simple visual inspection to needing TOC, conductivity, etc., and from there to needing specific methods are not clear. The use of the scale based on visual detection limits discussed in this article may provide a tool to help resolve this question for visual inspection.
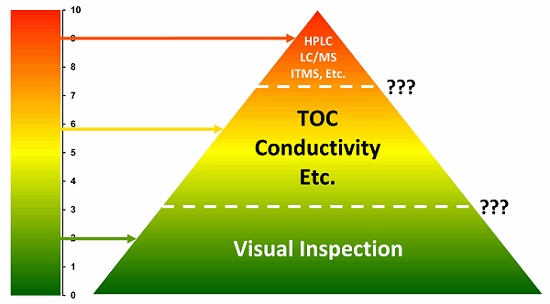
Figure 1: Risk hierarchy of analytical methods (Note: Toxicity Scale is based on –log(ADE) where ADE is the Acceptable Daily Exposure in grams)
Detection Limits For Visual Inspection
While the potential for using visual inspection in the validation of cleaning was proposed by Doug Mendenhall as long ago as 1989,3 there have not been many actual studies performed or publications on using it. In 1993, Fourman and Mullen4 published an article on cleaning validation acceptance limits where they stated:
Spiking studies have determined that the active ingredients in most products are visible at approximately 100µg per 2 X 2 in. swab area.
This single sentence has somehow become a de facto industry standard in the minds of many industry workers, although no data or any information other than the sentence quoted above was provided by the authors. The "100µg per 2 X 2 in. swab area" translates into 4µg/cm2, and it is the 4µg/cm2 value that is most frequently quoted, although that's not what was actually written in the article. Shortly after, in 1994, Jenkins and Vanderwielen stated that the VRL (visual residue limit) could be reduced to 1µg/cm2 if a light source is used during the inspection.5 In 1998, two workers at Bristol-Myers Squibb published an article referencing a study where they had used visual inspection as the sole method for solid dosage packaging equipment.6 In 2004, Richard Forsyth and coworkers at Merck started publishing a series of articles in which they claimed that VRLs for APIs and common excipients could be seen down to 2µg/cm2 and even as low as 1µg/cm2. These studies used a "spotting" technique to apply the residues, which may have made the residues easier to see. However, based on the results of only four observers in their initial article, they concluded that visual inspection had many challenges making it difficult to justify.7 More recently, Forsyth published an article on the logistical difficulties involved in qualifying a large group of personnel without knowing the VRLs of the products.8 A statistical study by Mohammad Ovais in 2010 demonstrated that the VRL could be determined using logistic regression analysis of the inspection data.9 Subsequently, a series of studies using large numbers of observers was performed at Stevens Institute of Technology from 2011 to 2013, employing an "even coating" technique that found VRLs for one particular product to range from 3 to7µg/cm2, which were found to be dependent on training.10
While there is not a lot of supporting data at this point in time, it appears reasonable to say that the VRL for the majority of products, under the majority of viewing conditions, probably lies somewhere between 1 and 10µg/cm2, depending on the product, type of surface (so far only stainless steel has been evaluated), the training of the inspectors, the preparation of the test coupons, and possibly the environmental conditions of the inspection.
If it is truly the case that the majority of drug product residues on equipment can be discerned by visual inspection in the range of 1 to 10µg/cm2, then equipment could be released after cleaning, and cleaning procedures could even be validated, using only visual inspection as long as the MSSR levels were safely above this range. If the MSSRs are set too low using arbitrary limits, then visual inspection would be harder to justify, limiting its usefulness.
Impact Of 1/1,000th Dose And 10ppm Limits On The Use of Visual Inspection
A recent article examined 304 drugs from several companies and compared their ADEs to their corresponding 1/1,000th of the lowest therapeutic dose.11 This article revealed that the limits calculated by the 1/1,000th were not low enough in about 15 percent of the cases and were too low in 85 percent of the cases – by as much as 10x, 100x and, in a few cases, over 1,000x (Figure 2).

Figure 2: Comparison of ADEs to the 1/1,000th dose
The cases where the ADEs were 85 percent higher are very significant to this discussion, as this is where continuing the use of the 1/1,000th or 10ppm will preclude the use of visual inspection in many of these cases, especially if both are used in combination.
To illustrate the impact that the 1/1,000th or 10ppm limits have on the use of visual inspection, the MSSRs were calculated for the 304 ADEs and their corresponding 1/1,000th limit using the following assumptions:
Table 1: Parameter Values Used For Calculations

The MSSR (Maximum Safe Carryover/Total Equipment Surface Area) was calculated.
The data obtained was then plotted using R statistical software and, just as in the previous article,11 the data had to be plotted on a log scale in order to visualize it all on one graph. The results can be seen in Figure 3.

Figure 3: Comparison of ADE, 1/1,000th and 10ppm to visual residue limits (10µg/cm2)A line has been drawn at the 10µg/cm2 level for the VRL. Obviously, many of these compounds could not be considered for evaluation by visual inspection as the MSSRs based on the 1/1,000th dose or 10 ppm are below the VRL or too close to it to be justified as a safe method of analysis. However, if only the ADE is used to calculate the MSSRs, then many of these compounds could easily be considered for evaluation by visual inspection (Figure 4).

Figure 4: Drug products where ADE can meet visual residue limits (10µg/cm2)It would seem that the compounds on the right side of the curve in the rectangle could easily be justified for evaluation by visual inspection. But as we move to the left and the MSSRs get closer and closer to the 10µg/cm2 VRL, it would seem harder to justify evaluation by visual inspection (Figure 5).

Figure 5: Where is visual inspection appropriate to use?
Would it not be helpful to have some way of judging how close the MSSR is to the VRL and whether it is acceptable to use?
Using MSSR As A Measure Of Detectability
Since we are trying to measure how close the MSSR is to the VRL so we can make a decision on whether we can use visual inspection, a simple method to measure the relative distance regardless of what the MSSRs or the VRLs happen to be is to look at the ratio of the two values. If we then take the log of this ratio we can obtain a logarithmic scale that equals "0" when the values of the MSSR and VRL are equal and becomes negative when the VRL is lower than the MSSR and positive when it is higher. This calculation would provide us with a visual detection index that could be applied across all manufacturing situations (Equation 1):

Table 2 shows the range of VDIs for different MSSRs based on VRLs of 5ug/cm2 and 10µg/cm2.
Table 2: Example Of Visual Detection Index Scales For Different MSSRs And VRLs

In this example, any VDI above 0 is unacceptable, with VDIs below -1.0 being acceptable. A VDI of 0 can be considered the "vanishing point" where an MSSR equals its VRL and is about to pass below it. Consequently, each company could select how close to a VDI of 0 it believes is justifiable before allowing visual inspection to be used. For example, one company may require all its VDIs to be < -2.0, or at least 2 logs below this vanishing point.
Discussion
The selection of methods for assessing cleaning should be science-based and risk-based. Risks to consider in the risk assessment can include the hazard or risk of the process residue to be analyzed (toxicity score), level of detection required, applicability of existing methods, other quality and compliance risks, as well as risks to the business, such as difficulty of implementation and the possible long-term maintenance of the method for ongoing monitoring programs. A reasoned and logical approach needs to be taken, as some methods may be unnecessarily expensive or difficult to implement for the process residues under consideration. Conversely, a simple, inexpensive method may not be appropriate for all process residues. In general, the simplest techniques should be examined first and used if determined to be appropriate through an assessment based on science and risk. Ultimately, the goal should be to use the simplest technique that is appropriate and can be justified. Visual inspection could be the sole method if properly justified based on risk.
As noted in a previous article on visual inspection, U.S. regulation 21 CFR 211.67 (b) (6) has required the "inspection of manufacturing equipment immediately gbefore use" since 1979 and, in practice, pharmaceutical manufacturers have been releasing equipment based on a “visual" inspection for many years. Subsequently, the industry and even regulators have come to see this "inspection" as a "visual inspection" requirement. For example, the Pharmaceutical Inspection Co-operation Scheme (PIC/S) recommends “no quantity of residue should be visible on the equipment after cleaning procedures are performed.” Similar statements can be found in many of the regulatory guidances on cleaning. PIC/S also mentions "spiking studies should determine the concentration at which most active ingredients are visible.”
Recently, it appears that regulators are open to the possible use of visual inspection for cleaning validation. The draft of Annex 15 in Paragraph 9.2 originally stated:
A visual check for cleanliness may form an important part of the acceptance criteria for cleaning validation however, it is not acceptable for this criterion alone to be used.
However, after comments from industry stakeholders, in the final version of Annex 15 Paragraph 10.2 this was changed to:
A visual check for cleanliness is an important part of the acceptance criteria for cleaning validation. It is not generally acceptable for this criterion alone to be used.
It should be noted that Annex 15 is used by PIC/S, which has 49 health authorities as members, including the FDA, which joined PIC/S in January of 2011. So, it appears that most of the world's health authorities are ready to accept visual inspection for cleaning validation under the right circumstances and justification. The question, of course, is under what circumstances and justification.
This new detectability scale for visual inspection can be used in conjunction with the ADE-derived toxicity scale1 and the Cpu-derived probability scale2 as tools to evaluate the level of risk in cleaning validation. Going further, the toxicity scale could also help define the circumstances for visual inspection (a low hazard) and the detectability scale can provide the justification (easy to see at levels well below the safe limit for that hazard). This has the potential to help justify visual inspection in clinical manufacturing or R&D areas where there are limited amounts of API available for analytical method development and help speed and simplify the introduction of new compounds in a safe manner.
To move forward on implementing visual inspection as a method for cleaning validation, we believe it will be important to develop and maintain a formal visual inspection program, including justification through risk assessments, training and qualification of operators and inspectors, and with periodic assessments to ensure the integrity of the program. Future articles will examine the implementation of visual inspection in both clinical and commercial manufacturing environments.
A subsequent article will discuss how another detectability scale can be developed using total organic carbon detection limits and TOC swab limits, and a final article will discuss how all these new scales can be used together to create a cleaning risk dashboard and how they can also be used for scoring cleaning FMEAs (failure modes and effects analyses)/FMECAs (failure mode effects and criticality analyses) of cleaning processes.
Peer Reviewers: Sarra Boujelben; Gabriela Cruz, Ph.D.; Mallory DeGennaro; Parth Desai; Ioanna-Maria Gerostathi; Miquel Romero Obon; Joel Young; and Ersa Yuliza
References:
- Walsh, Andrew, Ester Lovsin Barle, Michel Crevoisier, David G. Dolan, Andreas Flueckiger, Mohammad Ovais, Osamu Shirokizawa, and Kelly Waldron, "An ADE-Derived Scale For Assessing Product Cross-Contamination Risk In Shared Facilities," Pharmaceutical Online, May 2017.
- Walsh, Andrew, Ester Lovsin Barle, David G. Dolan, Andreas Flueckiger, Igor Gorsky, Robert Kowal, Mohammad Ovais, Osamu Shirokizawa, and Kelly Waldron, "A Process Capability-Derived Scale For Assessing Product Cross-Contamination Risk In Shared Facilities," Pharmaceutical Online, August 2017.
- Mendenhall, D., “Cleaning Validation,” Drug Development and Industrial Pharmacy, 15(13), pp. 2105-2114, 1989
- Fourman, G.L., and Mullen, M.V., "Determining Cleaning Validation Acceptance Limits for Pharmaceutical Manufacturing Operations," Pharmaceutical Technology, 1993, Vol. 17, No. 4, pp 54-60.
- Jenkins K.M. and A.J. Vanderwielen, "Cleaning Validation: An Overall Perspective", Pharm. Technol. 18 (4), 60–73 (1994).
- Alvey, A. P., and Carrie, T.R. "Not Seeing is Believing — A Non-Traditional Approach for Cleaning Validation," Journal of Validation Technology, May 1998, Vol. 4, Issue 3.
- Richard J. Forsyth, Vincent Van Nostrand, and Gregory P. Martin, "Visible-Residue Limit for Cleaning Validation and its Potential Application in Pharmaceutical Research Facility," Pharmaceutical Technology, Oct. 02, 2004.
- R. Forsyth, "Qualifying Personnel to Visually Inspect Cleaned Equipment Part II: Small vs. Large Group Training," Pharmaceutical Technology 40 (6) 2016.
- Ovais, Mohammad, "Statistically Justifiable Visible Residue Limits," Pharmaceutical Technology, 2010, Volume 34, Number 3.
- Desai, Parth and Andrew Walsh, "Evaluation of Visual Inspection for use in Cleaning Validation - Part I,” Pharmaceutical Online, September 2017.
- Walsh, Andrew, Michel Crevoisier, Ester Lovsin Barle, Andreas Flueckiger, David G. Dolan, and Mohammad Ovais, "Cleaning Limits—Why the 10-ppm and 0.001-Dose Criteria Should be Abandoned, Part II," Pharmaceutical Technology, 40 (8), 45-55 (2016).