
Beyond The Plate Count: How To Build A Defensible Environmental Monitoring Trend Review
By Ratul Saha, Ph.D., Director, Global Sterility Assurance Programs, Bausch + Lomb

A sterile manufacturing site may generate thousands of environmental monitoring (EM) results each month from active air samples, settle plates, contact plates, glove and gown samples, total particle monitoring, and facility parameters. Yet the value of many results effectively ends when they are compared with an alert level or action limit. A single result describes one sample at one point in time. Determining whether an environment is stable, drifting, or developing a recurring loss-of-control signal requires integrated trend evaluation.
That expectation is explicit in current regulatory requirements and guidance. EU GMP Annex 1 places EM within the contamination control strategy (CCS), requires procedures to define a trend-analysis approach, and identifies adverse patterns that the program should detect.¹ FDA guidance calls for short- and long-term review by location, shift, room, and operator and warns that averaging can conceal unacceptable localized conditions.² United States Pharmacopeia (USP) General Chapter <1116> emphasizes contamination recovery rate (CRR), the percentage of samples with any microbial recovery, as a useful measure for sparse, low-count aseptic-environment data.³
This article focuses primarily on environmental monitoring for sterile manufacturing and aseptic processing. The underlying principles may also support terminally sterilized and non-sterile operations, but the risk significance, sampling strategy, identification depth, alert and action criteria, and escalation pathways should be adapted to the process, product exposure, and applicable regulatory requirements.
A sound program depends on reliable data, appropriate metrics, microbial identification, process context, and documented decisions that demonstrate whether the CCS remains effective.4
EM As An Effectiveness Check For The CCS
Environmental monitoring provides evidence of whether contamination controls continue to perform as intended. Annex 1 cautions that no monitoring element, including viable monitoring, total particle monitoring, or even aseptic process simulation, should be considered in isolation as evidence of asepsis.¹ EM results gain meaning when evaluated with process events, interventions, cleaning and disinfection, HVAC performance, facility condition, personnel practices, and microbial identity.
The essential elements of an effective program are a documented risk assessment, qualified monitoring methods, a risk-based sampling plan, scientifically justified alert levels and action limits that meet applicable regulatory requirements, and trend review that supports documented decisions. Alert levels should provide early warning and should be periodically reviewed against qualification and routine data. Because EM data sets are commonly sparse, zero-heavy, and non-normally distributed, normal-distribution-based rules such as mean plus two or three standard deviations may be unsuitable. Nonparametric or attribute-based approaches may be more appropriate when supported by sufficient data and a defined rationale.5
What Trending Should Detect
Annex 1 identifies increasing numbers of alert- or action-level excursions, consecutive alert-level excursions, recurring isolated action-limit excursions with a possible common cause, and changes in the type, number, or predominance of microbial flora, particularly spore-formers and molds.¹ FDA guidance similarly emphasizes that an increased incidence of contamination may be as important as consecutive positive results.²
The response should remain risk-based. Consecutive alerts are not automatically equivalent to an action-limit excursion, and an association does not establish root cause. The location, grade, organism, magnitude, recurrence, process activity, and potential product exposure should determine escalation.
An adverse trend is a statistically or operationally meaningful deterioration in environmental control. It may provide an early warning of contamination risk before an action-limit excursion or aseptic process failure occurs. Each manufacturing site should define adverse-trend criteria within its approved procedures using product and process knowledge, quality risk management, historical performance, and applicable regulatory expectations.1,2,6
Collective review of excursions can reveal recurring factors and relationships that may not be apparent when events are assessed individually. Procedures should define both the patterns to be evaluated and the criteria for escalation.
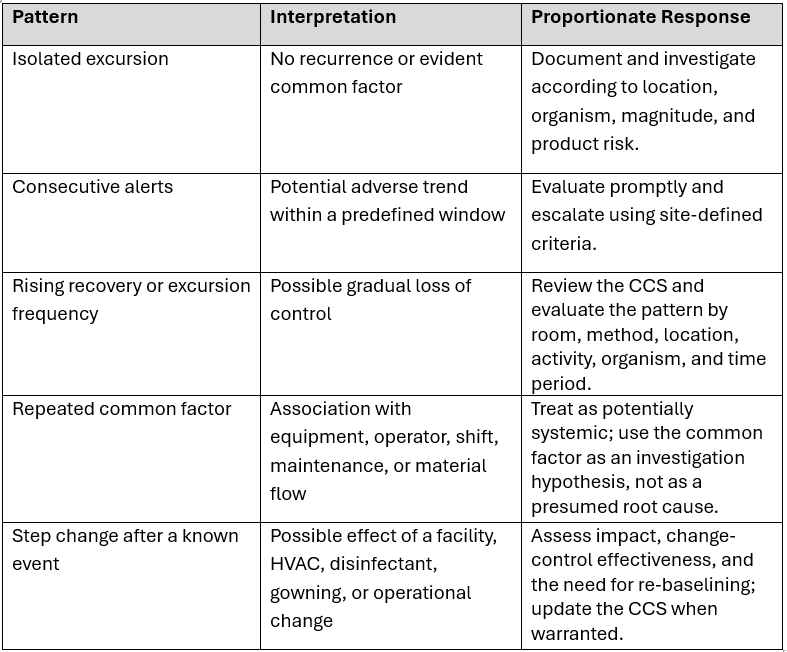
Table 1: Examples of EM patterns and proportionate responses.
Clean, Comparable Data Come First
Trend conclusions are dependable only when the underlying data are reliable. Sampling method, volume or exposure, media, incubation, recovery conditions, location identifiers, and result classification should be consistently defined. When a sampler, medium, incubation scheme, identification platform, or other method changes, the effect should be evaluated through change control and addressed by bridging, stratification, or re-baselining as appropriate. Electronic capture can reduce transcription risk, but governance remains essential: data must be attributable, complete, contemporaneous, and traceable throughout the life cycle.4,7
Effective EM data-management systems strengthen data integrity, reduce transcription and manual-analysis burden, support timely review, and help reviewers detect meaningful contamination-control signals.
Metrics should also be defined precisely. CRR is the number of samples with any recovery divided by the number of samples collected. Alert- and action-excursion rates use the applicable number of excursions and samples as their respective numerators and denominators. Results should not be pooled across grades, methods, or dissimilar locations merely to create a larger data set.
Selecting Appropriate Trending Methods
Run charts show time order and can reveal drift, periodicity, and step changes. Multi-series charts compare like-for-like locations or rooms. Bar and Pareto charts prioritize contributors. Spatial heat maps can reveal clustering around transfer routes, doors, utilities, or equipment, provided sampling-point identifiers are stable. Histograms and box plots can help explore distributions, but they require caution when results are dominated by zeros. Each visualization should identify the review period, method, population or stratum, numerator and denominator where applicable, and the decision the display is intended to support.
For low-recovery environments, CRR can be more informative than a monthly mean. Attribute charts, including p-charts when denominators vary, may support recovery-rate evaluation; g-charts can examine the number of opportunities between recoveries; and exponentially weighted moving average (EWMA) or cumulative sum (CUSUM) approaches may assist in detecting smaller sustained shifts. The selected technique should match the data structure and should supplement, not replace, microbiological and process judgment.
Use of advanced statistical methods requires a defined unit of analysis, adequate and reasonably comparable denominators, sufficient baseline data, and predefined handling of changes to methods, sampling plans, facilities, or processes. Noncomparable grades, methods, rooms, or locations should not be pooled solely to increase sample size, and a statistical signal should trigger risk-based evaluation rather than serve as the sole basis for a contamination-control conclusion.
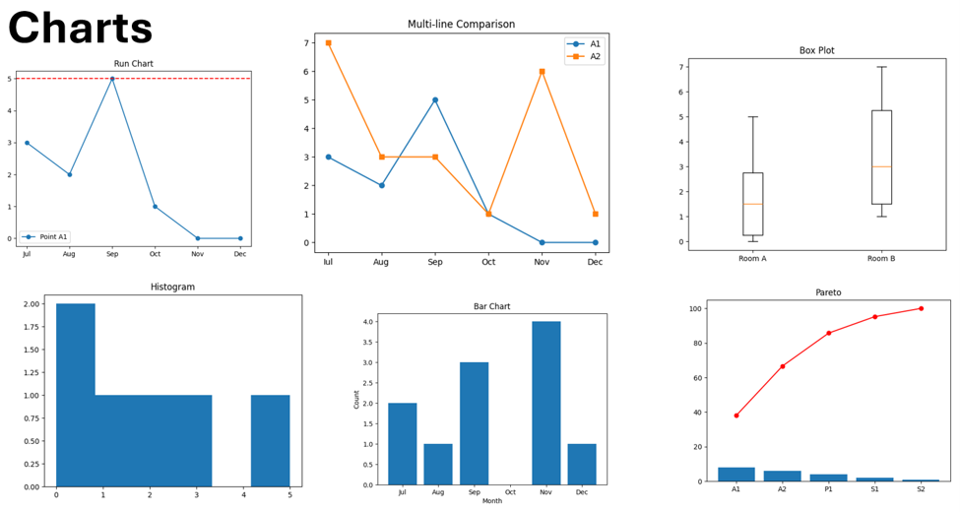
Figure 1: Core visualization options for EM trending. Each chart answers a different question; illustrative data.
Illustrative Interpretation Of EM Data
A hypothetical facility collected 6,900 viable EM samples over 12 months across three cleanroom grades and three monitoring methods. Eleven results exceeded alert levels but remained within action limits, and six additional results exceeded action limits. Using mutually exclusive categories, the overall excursion rate is 17/6,900, or 0.25%. Although this aggregate result may suggest stable performance, it does not show whether recoveries are concentrated by grade, method, room, or organism and is insufficient, on its own, to demonstrate a state of control.
Figure 2 provides the first level of stratification. CRR increases from Grade B through Grades C and D for each monitoring method, consistent with the cleanliness hierarchy represented in this data set. Settle plate CRRs are lower than active air CRRs, while surface CRRs are highest. Because these methods differ in sampling mechanism, exposure conditions, recovery efficiency, and denominator, their absolute values should be compared with method- and location-specific baselines rather than with one another. Seasonal influences, particularly on environmental molds, should be evaluated against site history, relevant outdoor data, and sample size.8
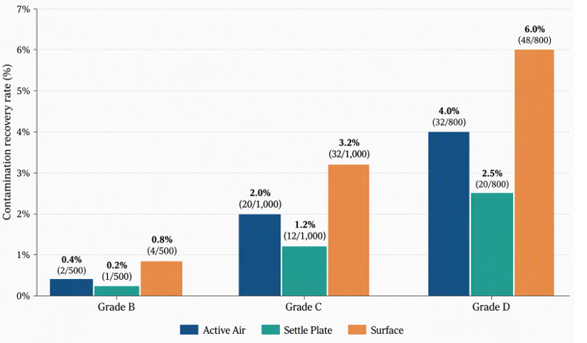
Figure 2: Twelve-month method-specific CRRs by cleanroom grade; illustrative data. Each method is shown with its own numerator and denominator and should be interpreted against a comparable baseline. The Grade C surface result is 32/1,000 (3.2%).
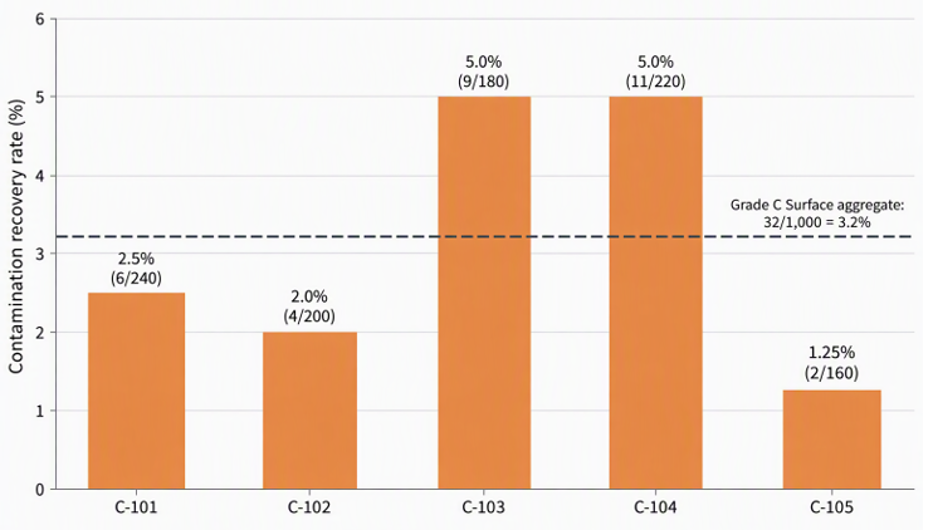
Figure 3: Grade C surface CRR stratified by room; illustrative data. Room-level results total 32 recoveries among 1,000 samples.
Figure 3 separates the 1,000 Grade C surface samples summarized in Figure 2 by room. The room-level results total 32 recoveries from 1,000 samples, preserving the weighted aggregate of 3.2%. C-103 and C-104 each have a 5.0% CRR and together account for 20 of the 32 recoveries. This concentration identifies priorities for investigation but does not establish a common cause. Figure 4 examines organism type within the same sample population. Thirteen of the 32 positive Grade C surface samples contained mold, giving a mold CRR of 13/1,000 (1.3%); 12 of these 13 mold-positive samples occurred in C-103 and C-104. The combined room and organism pattern warrants focused assessment of moisture and ingress pathways, facility fabric, inaccessible surfaces, HVAC performance, material transfer, and cleaning and sporicide application. These are investigation hypotheses, not established root causes. Conclusions and corrective actions should be supported by facility, process, maintenance, environmental, and microbial-identification evidence.
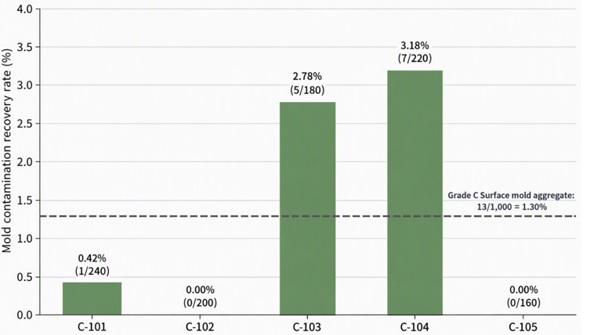
Figure 4: Grade C surface mold CRR stratified by room; illustrative data. Mold-positive samples are a subset of the total surface recoveries in Figure 3. Room-level mold results total 13/1,000 (1.3%), with 12 of 13 mold-positive samples occurring in C-103 and C-104.
Microbial Identification And Population Trends
Count-only trending is insufficient because identical counts can have different implications depending on the organism and location. Annex 1 expects microorganisms recovered from Grade A and B areas to be identified to species level and their potential effect on product quality and state of control to be evaluated.¹ Identification in lower-grade areas should be risk-based and should support assessment of excursions, adverse trends, and changes in flora.4 Spore-formers and molds warrant particular attention because of their persistence, sources, and potential routes of spread, as illustrated in Figure 4.
Trending may proceed from broad microbial groups to genus and species. A shift toward Gram-negative rods may prompt evaluation of water systems or wet niches; increased recovery of spore-formers may focus attention on material transfer, cleaning, and sporicide application; and molds may direct attention to ingress, moisture, facility fabric, or HVAC performance. These are source hypotheses, not conclusions. Their significance depends on recurrence, location, process association, and comparison with personnel, material, utility, and facility isolates. Mold recoveries should be identified, and a separate mold trend is often valuable because fungal ecology and routes of ingress differ from those of bacteria. In many operations, mold is a microorganism of concern and may be considered objectionable based on the product, process, or route of administration.9
Minimum Elements Of A Defensible EM Trend Review
- Defined review period, scope, and confirmation of data completeness
- Stratification, as applicable, by grade, room, location, method, activity, shift, operator, and organism
- CRR and alert- and action-excursion rates with clearly defined numerators and denominators
- Comparison with historical performance, relevant baselines, and comparable peer locations
- Assessment of changes in microbial type, number, recurrence, or predominance
- Review of relevant facility, HVAC, cleaning and disinfection, intervention, maintenance, personnel, and process events
- A documented conclusion regarding state of control and CCS effectiveness
- Defined actions, owners, due dates, effectiveness checks, and watchlist items, when applicable
Documenting Conclusions And Follow-Up Actions
A trend report should describe observed changes, assess their significance to product and patient risk within the CCS, document actions taken, and assign any required follow-up. It should also identify conditions that warrant continued observation. When no adverse change is detected, that conclusion should be recorded to provide a traceable assessment of the monitoring period. EM and trend data should be considered during batch certification and the effectiveness of the CCS should be reviewed periodically through management review.¹
Cross-functional governance is essential because organism-, operator-, equipment-, facility-, and HVAC-associated signals rarely belong to one department. Microbiology, quality, operations, facilities, and engineering should review relevant trends together. Common weaknesses include trending only after an excursion, using averages without distributions, pooling dissimilar methods or grades, failing to re-evaluate alert levels, reporting critical-area isolates only by broad morphology, and issuing charts without interpretation.
Rapid and continuous methods may shorten the interval between sampling and detection, while mass spectrometry and sequencing can make species-level population analysis more practical. Properly qualified and governed multivariable tools may help identify related changes across counts, organisms, operations, and facility parameters. These technologies support microbiological judgment; they do not replace it.
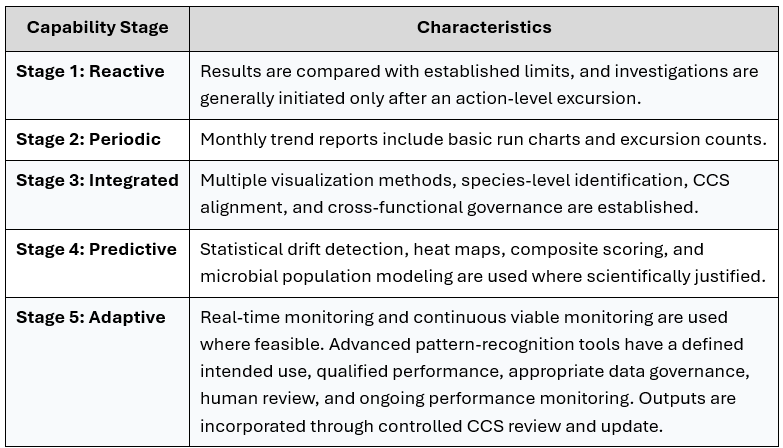
Table 2: Proposed EM program capability framework.
Table 2 presents the author's proposed capability framework and is not a regulatory standard. The stages are cumulative, and advanced analytics cannot compensate for weaknesses in sampling design, data integrity, method comparability, microbial identification, investigations, or governance. Predictive or adaptive capability should be claimed only when these foundational controls are effective and the tools are suitable for their intended use.
Turn EM Trends Into Defensible Decisions
Effective EM trending demonstrates the continuing performance of the CCS through reliable and comparable data, metrics suited to sparse microbiological results, analysis at relevant temporal and spatial levels, microbial identification sufficient for risk assessment, and governance that ensures appropriate follow-up. Each report should state whether the environment remains in control, identify signals that require continued observation, and document resulting actions. Used in this way, EM data supports timely and defensible contamination-control decisions.4
Disclaimer: This article reflects my personal views as a subject matter expert and does not represent the position of any organization.
References:
- European Commission. EudraLex Volume 4, Annex 1: Manufacture of Sterile Medicinal Products. 2022; in operation Aug. 25, 2023.
- U.S. Food and Drug Administration. Guidance for Industry: Sterile Drug Products Produced by Aseptic Processing — Current Good Manufacturing Practice. 2004.
- United States Pharmacopeia. General Chapter <1116>, Microbiological Control and Monitoring of Aseptic Processing Environments. Current official edition.
- Saha R. Applied Pharmaceutical Microbiology: A Practical Guide to Contamination Control, Sterility Assurance and GMP Compliance. 2026. ISBN 979-8171886806.
- Swissmedic. Interpretation of GMP Annex 1 2022 (Rev. 1). I-SMI.TI.25e, Version 1.0. 2023.
- International Council for Harmonisation. ICH Q9(R1): Quality Risk Management. 2023.
- Pharmaceutical Inspection Co-operation Scheme. PI 041-1: Good Practices for Data Management and Integrity in Regulated GMP/GDP Environments. 2021.
- Shelton BG, Kirkland KH, Flanders WD, Morris GK. Profiles of airborne fungi in buildings and outdoor environments in the United States. Appl Environ Microbiol. 2002;68(4):1743-1753.
- Sandle T. A review of cleanroom microflora: types, trends, and patterns. PDA J Pharm Sci Technol. 2011;65(4):392-403.
About The Author:
 Ratul Saha, Ph.D., is a pharmaceutical microbiologist with more than 15 years of experience spanning the pharmaceutical, biopharmaceutical, and medical device industries. He currently serves as director of global sterility assurance programs at Bausch + Lomb and as an adjunct professor at Temple University, where he teaches RAQA 5512, Microbiological Concepts in Pharmaceutical Manufacturing. His scientific contributions include serving as first author of the description of the novel bacterial species Klebsiella michiganensis. He is also the author of Applied Pharmaceutical Microbiology: A Practical Guide to Contamination Control, Sterility Assurance and GMP Compliance, from which this article is adapted.