
Calculating Process Capability Of Cleaning Processes With Partially Censored Data
By Andrew Walsh, Miquel Romero Obon, and Ovais Mohammad
 Part of the Cleaning Validation For The 21st Century series
The first article in this series discussed how the process capability of cleaning processes can be calculated1 and the second article examined the process capability of a cleaning process where total organic carbon (TOC) data was collected.2 As discussed in the second article, TOC data is ideal for process capability analysis as there is typically always some low carbon signal present on the manufacturing equipment surfaces. This provides for complete data sets that can be easily analyzed. All that is needed for the process capability calculation are the mean and standard deviation of these sample data. It is also recommended that the lower confidence interval (LCI) for the process capability be calculated, and the only other value needed for this is the number of samples (N), which is always known3.
A complication to these calculations arises when cleaning sample results are below the detection limits (DL) of an analytical method. These data are known as "non-detects" or "left-censored" data. This situation is quite common with data in many fields of science, including environmental and occupational safety.4,5 This is also common with many of the analytical methods such as high-performance liquid chromatography (HPLC) data where the method is analyzing for only a single component and may or may not detect that component. In many cases, some of these data will be "non-detects" and, often, all these data will be "non-detects." While process capability can obviously be calculated from cleaning data that is above the DL, readers may assume that process capability is not applicable to data where some or most of the data are below the DL, since calculating a mean and standard deviation would seem impossible to do. However, there are a number of methods for dealing with left-censored data to obtain acceptable estimates of the mean and standard deviation that have been used for many years in other scientific disciplines (air quality, water quality, astronomy, pharmacology, ecology, etc.) that commonly deal with left-censored data.6
There are basically two broad classes of methods that are applied to left-censored data: Substitution and Estimation.5 These methods can provide estimates of the mean and standard deviation for data that have points below the DL and, as such, would enable process capability calculations to be performed. This article explores some of these methods for use with cleaning sample data when some of the points are below the DL.
Substitution Methods
For many years, scientists have analyzed data sets containing left-censored data points using a number of substitution techniques, which are considered inadequate by many scientists today.4,5 Some of these commonly used techniques have been to simply remove the left-censored data points from the analysis (truncate) or to substitute data using four different methods. Each method has inherent issues with data analysis that make them undesirable. While these methods may be considered adequate for use in some disciplines, there is an issue with using these techniques for calculating process capability in that they all bias both the mean and the standard deviation.
Since both the mean and standard deviation are critical for calculating process capability, these techniques can result in process capability values that will be biased either high or low depending on how much the mean and standard deviations are affected and the direction of the bias (Table 1).
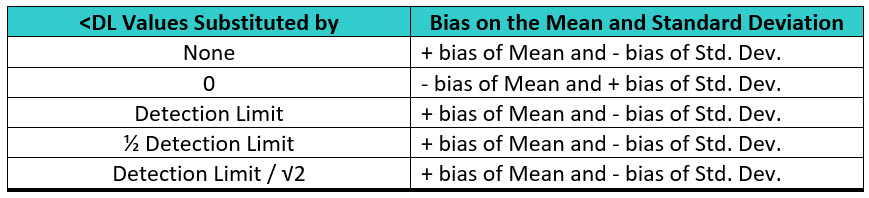
Table 1: Substitution Methods for Handling Left-censored Data and Their Bias on the Mean and Standard Deviation (+ = Positive / - = Negative)
While a bias on the mean may be serious, the bias on the standard deviation can be very significant, and this can have a major effect on the process capability results, as we will see in the following analysis.
Effects Of Substitution
To examine the effect of these techniques on process capability determinations, a random set of 150 normally distributed data were generated in Minitab statistical software in one column, with settings for a mean of 50 and a standard deviation of 10. The actual random data generated had a mean of 50.84 and a standard deviation of 9.42 (Figure 1). These data were then "truncated" (artificially censored) at the 50-ppb level to simulate a data set with a DL of 50 ppb (Figure 2).
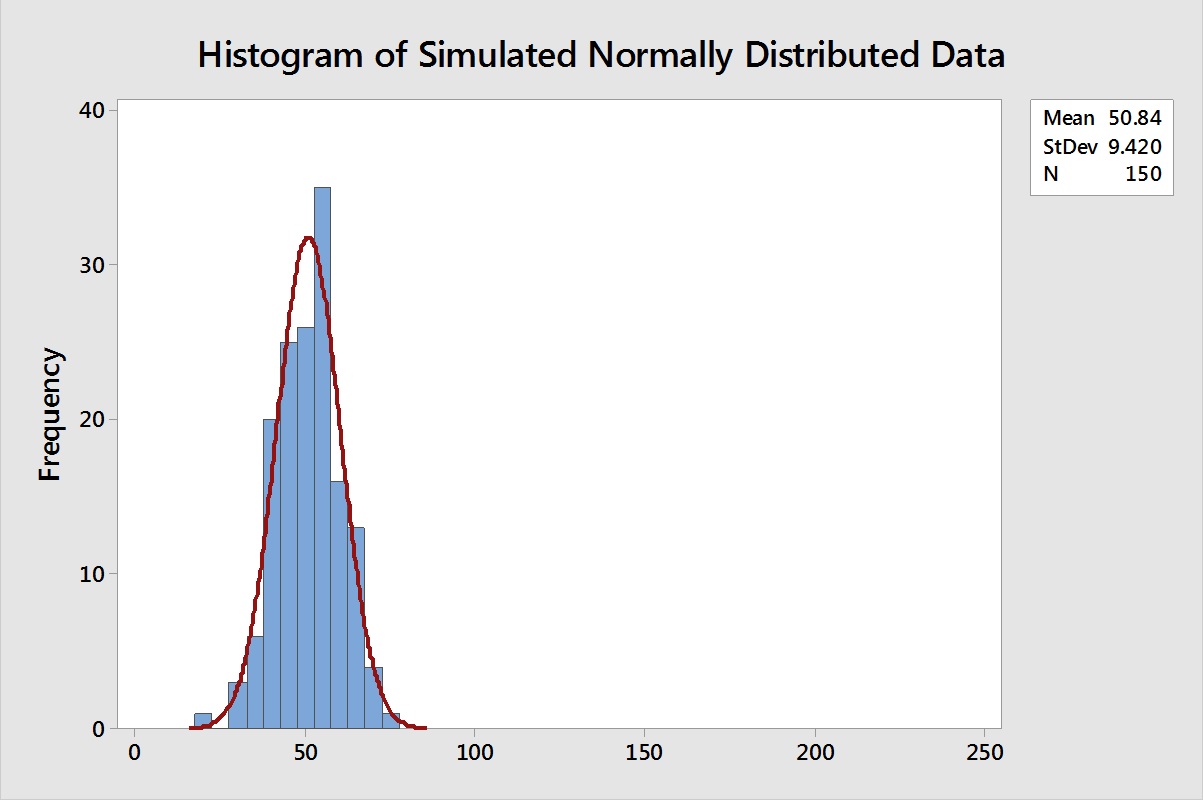
Figure 1: Histogram of 150 Normally Distributed Data.
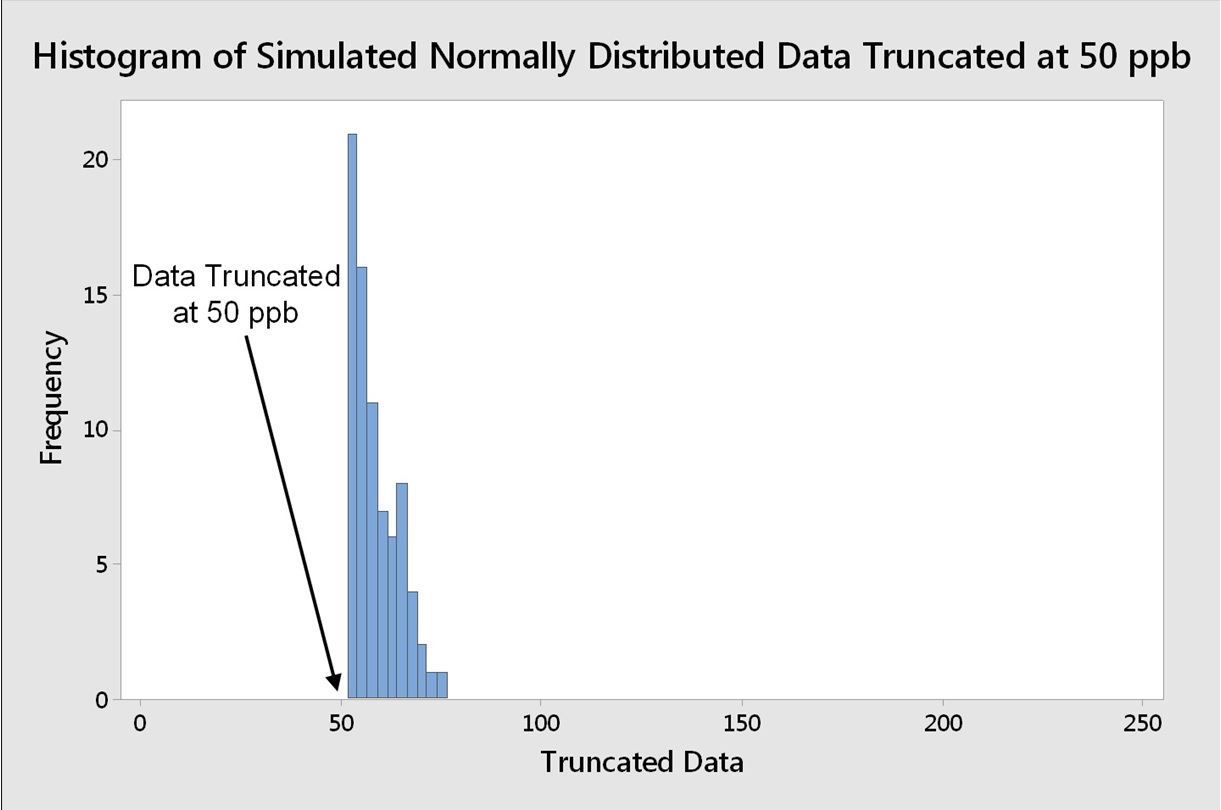
Figure 2: Histogram of 150 Normally Distributed Data Truncated at 50 ppb
Note: X-axis has been set from 0 to 250 throughout the article for consistent appearance of graphs.
This truncation removed about half of the data from the set, leaving 77 data points. To analyze the effects of substitution on these data, five (5) additional columns of data were created in Minitab, with 73 rows containing 0, 25 (one-half the DL), 35 (DL/√2), and 50 (the DL) as the data to be used for these substitutions.
The data in these columns can be seen overlaid with the truncated data to show the relationship of these substituted data to the truncated data in Figure 3. The data analysis issues with these substitution methods shown in Table 1 should be easier to understand simply by visually examining Figure 3.
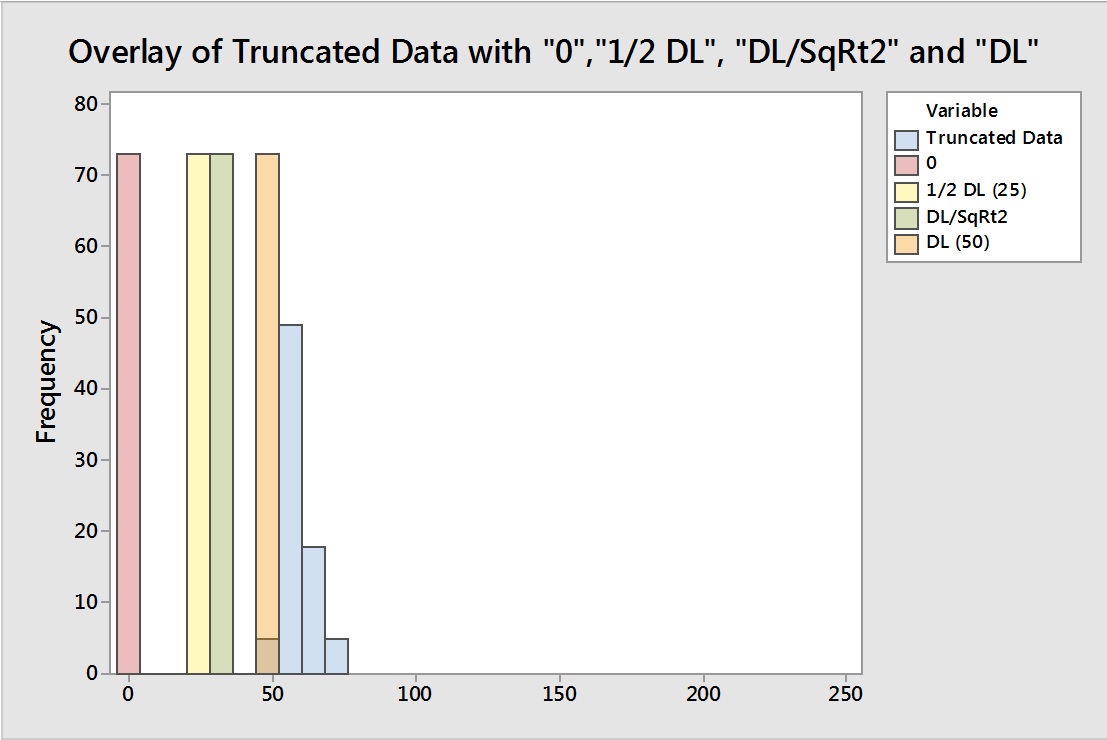
Figure 3: Overlay to Show the Positions of the Substituted Data Relative to the Truncated Data
The truncated data were then combined with each of these data sets to create five new sets of data:
- Truncated data alone (all left-censored data removed)
- Truncated data with all left-censored data set to 0 ppb
- Truncated data with all left-censored data set to ½ the DL (25 ppb)
- Truncated data with all left-censored data set to the DL/√2 (35 ppb)
- Truncated data with all left-censored data set to the DL (50 ppb)
Process capability analysis (assuming a normal distribution) was then run for each of these data sets with the upper specification limit set to 250 ppb and the results can be seen in Figures 4–9.
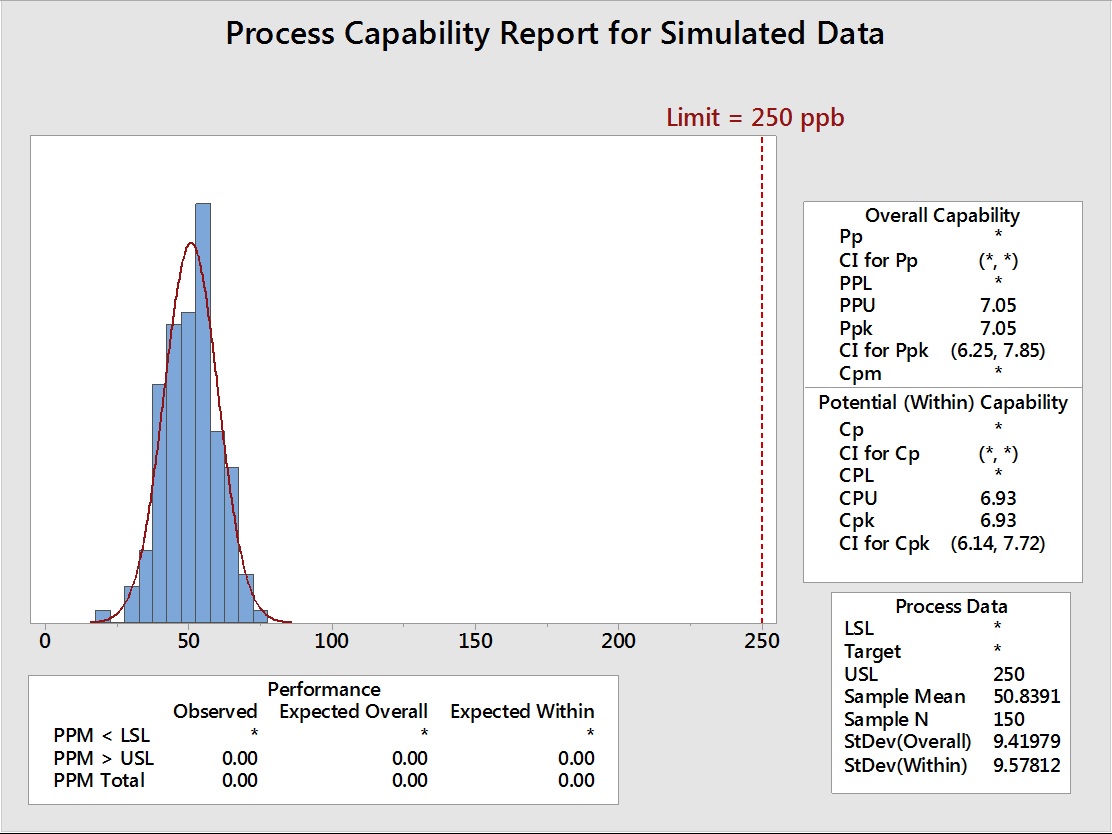
Figure 4: Process Capability Analysis of Simulated Data before Truncation
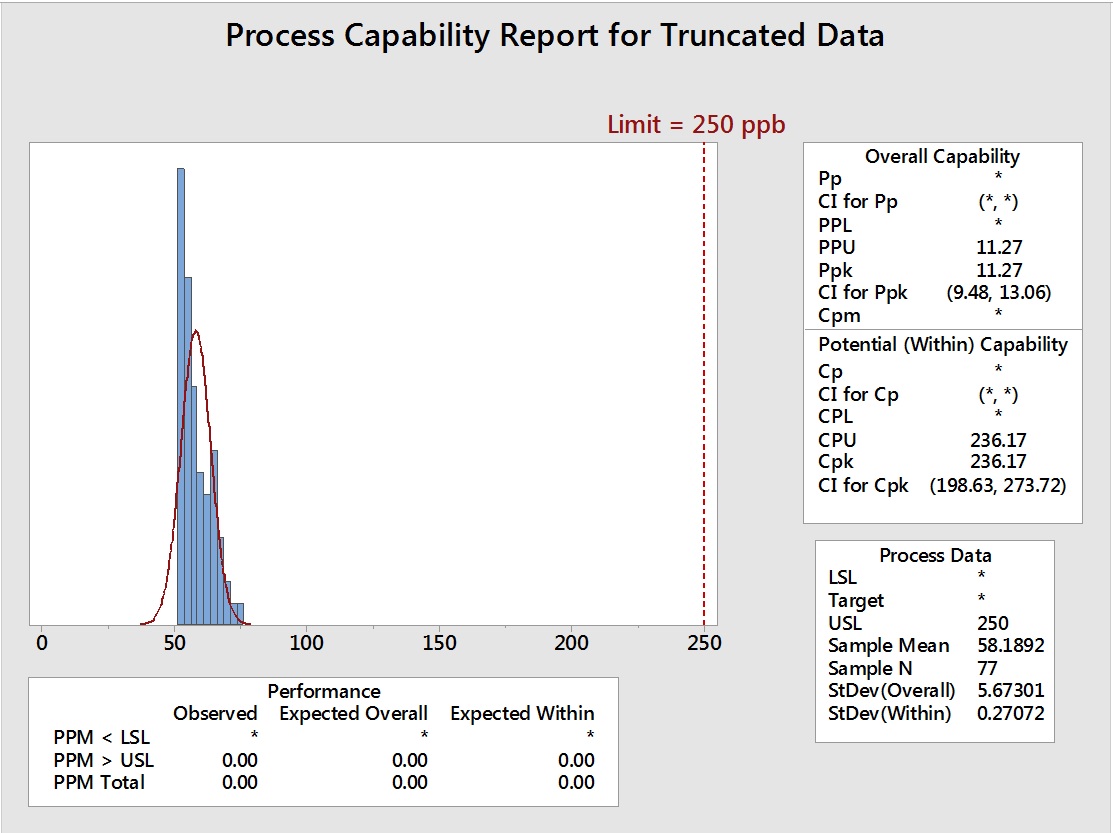
Figure 5: Process Capability Analysis of Truncated Data (73 data points removed)
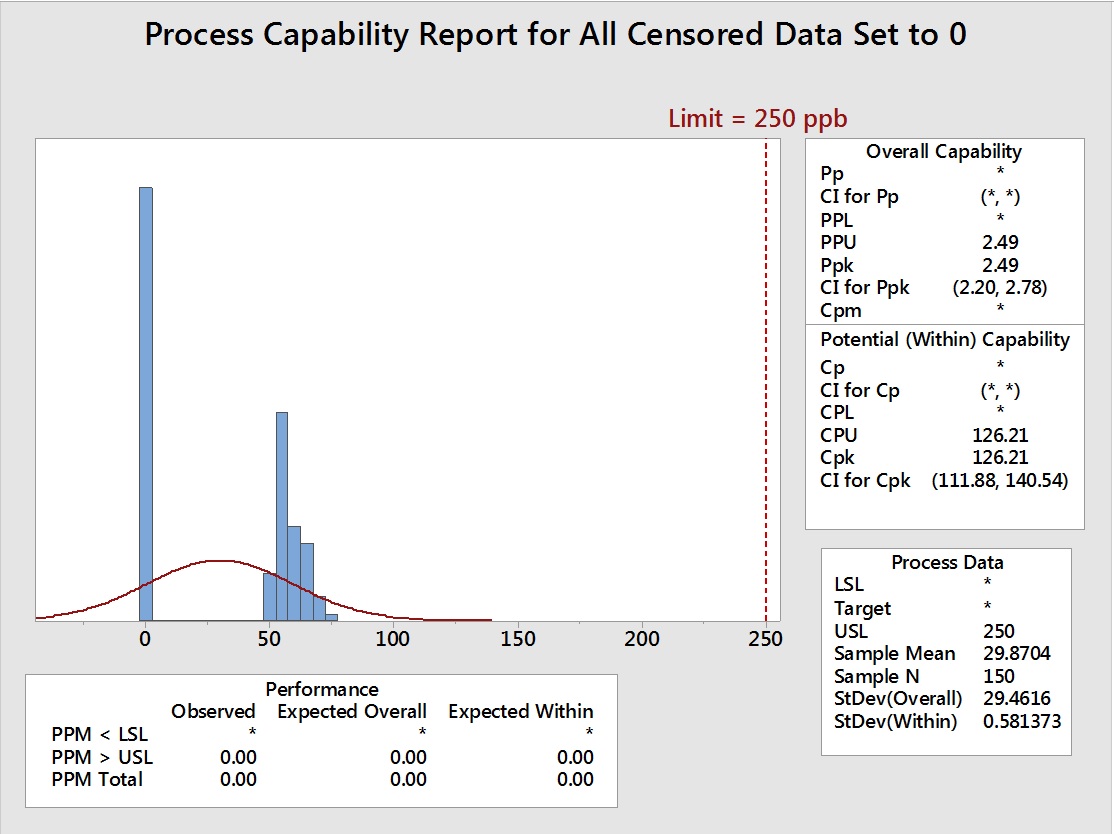
Figure 6: Process Capability Analysis with Left-Censored Data (73 data points) set to Equal to 0
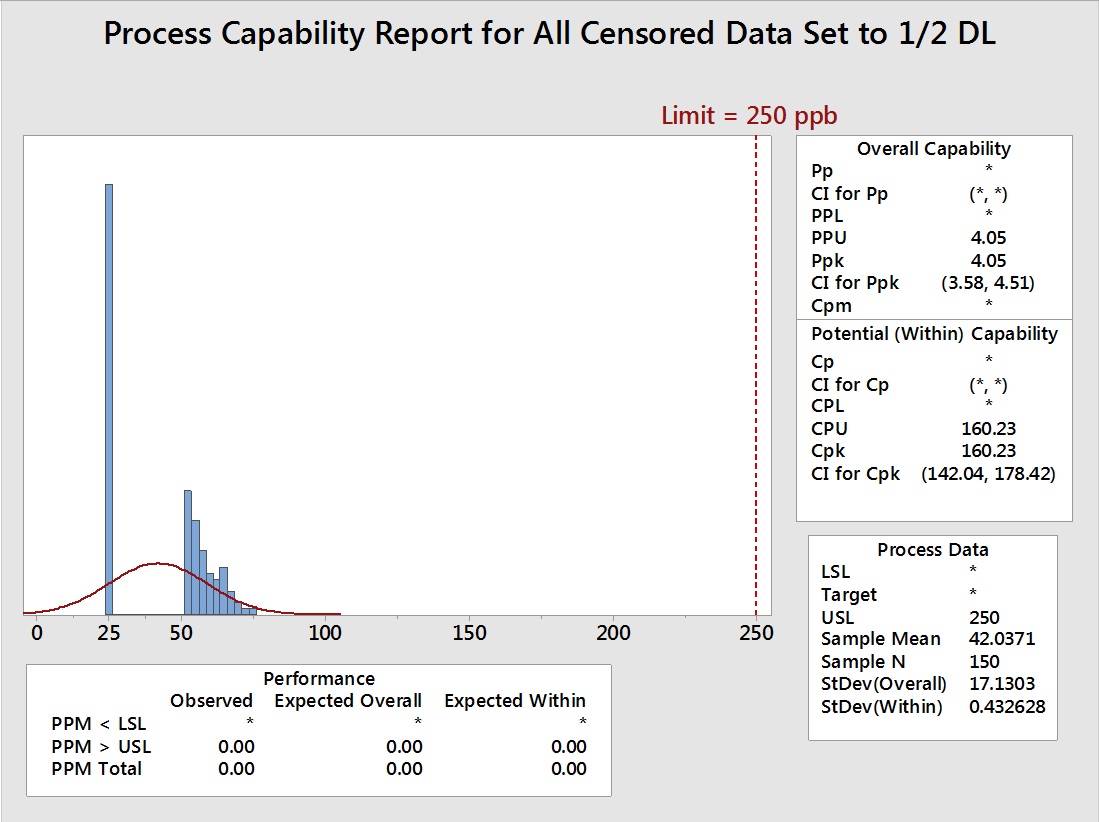
Figure 7: Process Capability Analysis with Left-Censored Data (73 data points) set to Equal to ½ the DL (25 ppb)
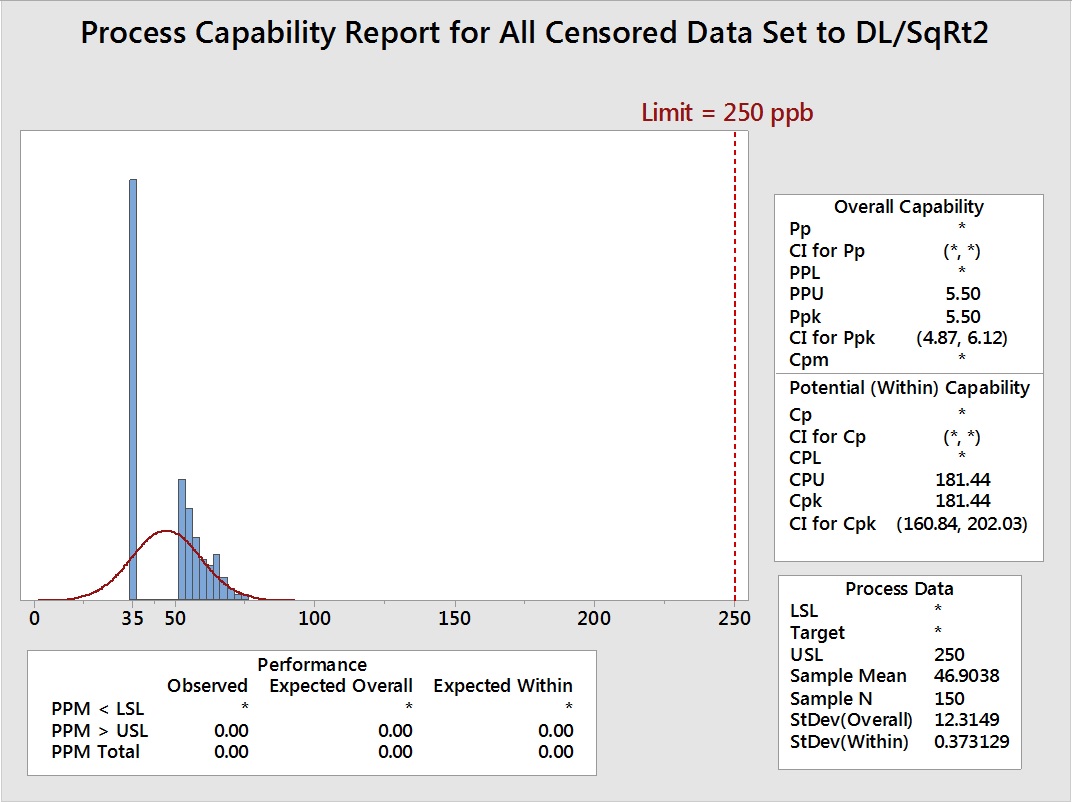
Figure 8: Process Capability Analysis with Left-Censored Data (73 data points) set to Equal to the DL/√2 (35 ppb)
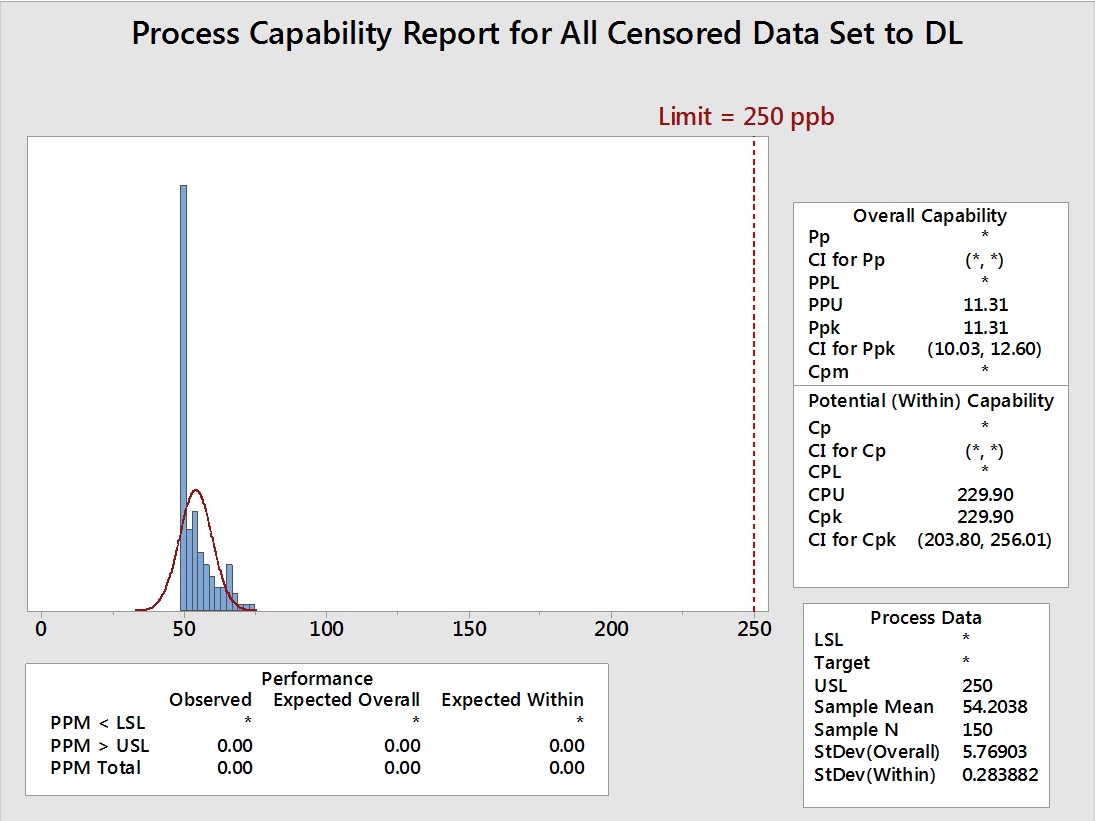
Figure 9: Process Capability Analysis with Left-Censored Data (73 data points) set to Equal to the DL (50 ppb)
The different effects of these substitutions on the mean and standard deviation can be easily understood just from a visual examination of these graphs. Table 2 summarizes the effects on the mean and standard deviation and the resultant effect on the process capability. The mean, standard deviation, and the process capability of the original data set are shown for comparison. If these substitution methods are to be considered acceptable, the mean, standard deviation, and the process capability should be approximately equal to those of the original data.
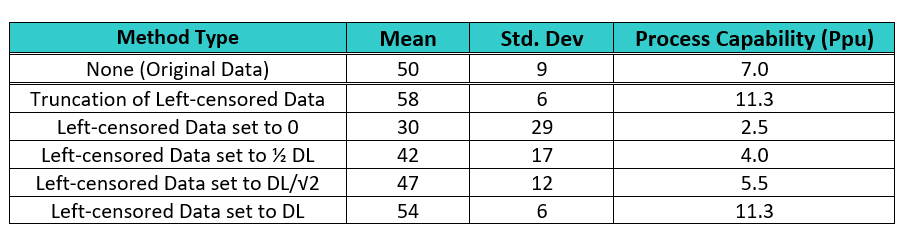
Table 2: Summary Statistics and Process Capabilities for Different Substitution Techniques of Handling Left-Censored Data
The data in Table 2 shows that the two methods of removal of the left-censored data (truncation) and setting the left-censored data to the DL significantly increased the mean and significantly decreased the standard deviation, resulting in exaggerated process capability results. Setting the left-censored data to 0 significantly decreased the mean and significantly increased the standard deviation and underreported the process capability. Setting the left-censored data to ½ the DL somewhat decreased the mean, significantly increased the standard deviation, and decreased the process capability. Setting the left-censored data to the DL/√2 slightly decreased the mean, slightly increased the standard deviation, and decreased the process capability. For cleaning validation purposes, it may be considered acceptable by some cleaning validation practitioners to use the worst case of these methods and substitute the left-censored data with 0. This would result in the lowest possible process capability value of the five methods as a seemingly worst case. But for the purposes of accurately assessing the level of risk of the cleaning process, none of these methods are acceptable.
Estimation Methods
As we saw in the analysis above, the mean and standard deviation may be significantly affected by the substitution methods, which directly impacts the process capability calculation. Since the mean and standard deviation are so important to process capability analysis, it is highly desirable to use a method that most accurately estimates these parameters for left-censored data. There are several methods for estimating the mean and standard deviation of censored data5 that are used in various fields that work with left-censored data (Table 3).
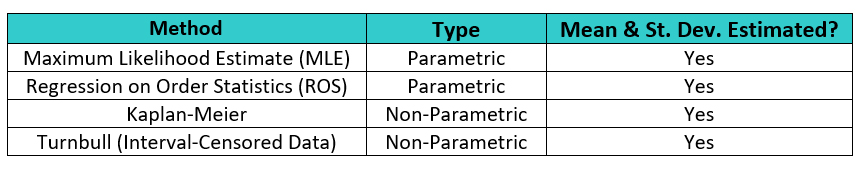
Table 3: Estimation Methods for Left-Censored Data
While there is consensus in the environmental monitoring field that the truncation/substitution methods are undesirable, there are varying opinions on which estimation methods are best suited for left-censored data.6 ,8, 9 ,10, 11, 12 Table 4 shows methods recommended based on the percentage of censoring of the data.
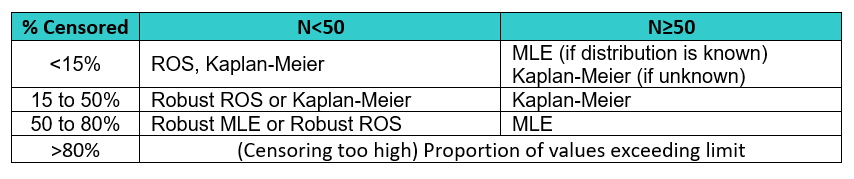
Table 4: Recommended Methods based on Percentage of Censored Data7, 8, 9, 10
The maximum likelihood estimate (MLE) is well known and the predominant method used for statistical inference; it is recommended by many researchers with censored data, so for this article we will examine the use of this technique.
Maximum Likelihood Estimate: Normal Distribution
The MLE technique starts with the assumption that a particular distribution (e.g., normal, lognormal, etc.) is a good fit for the actual uncensored data. The MLE computes a mean and standard deviation from the actual uncensored data and from the proportion of left-censored data that are below the DL. A graphical explanation of this method for a normal distribution is shown in Figure 10.
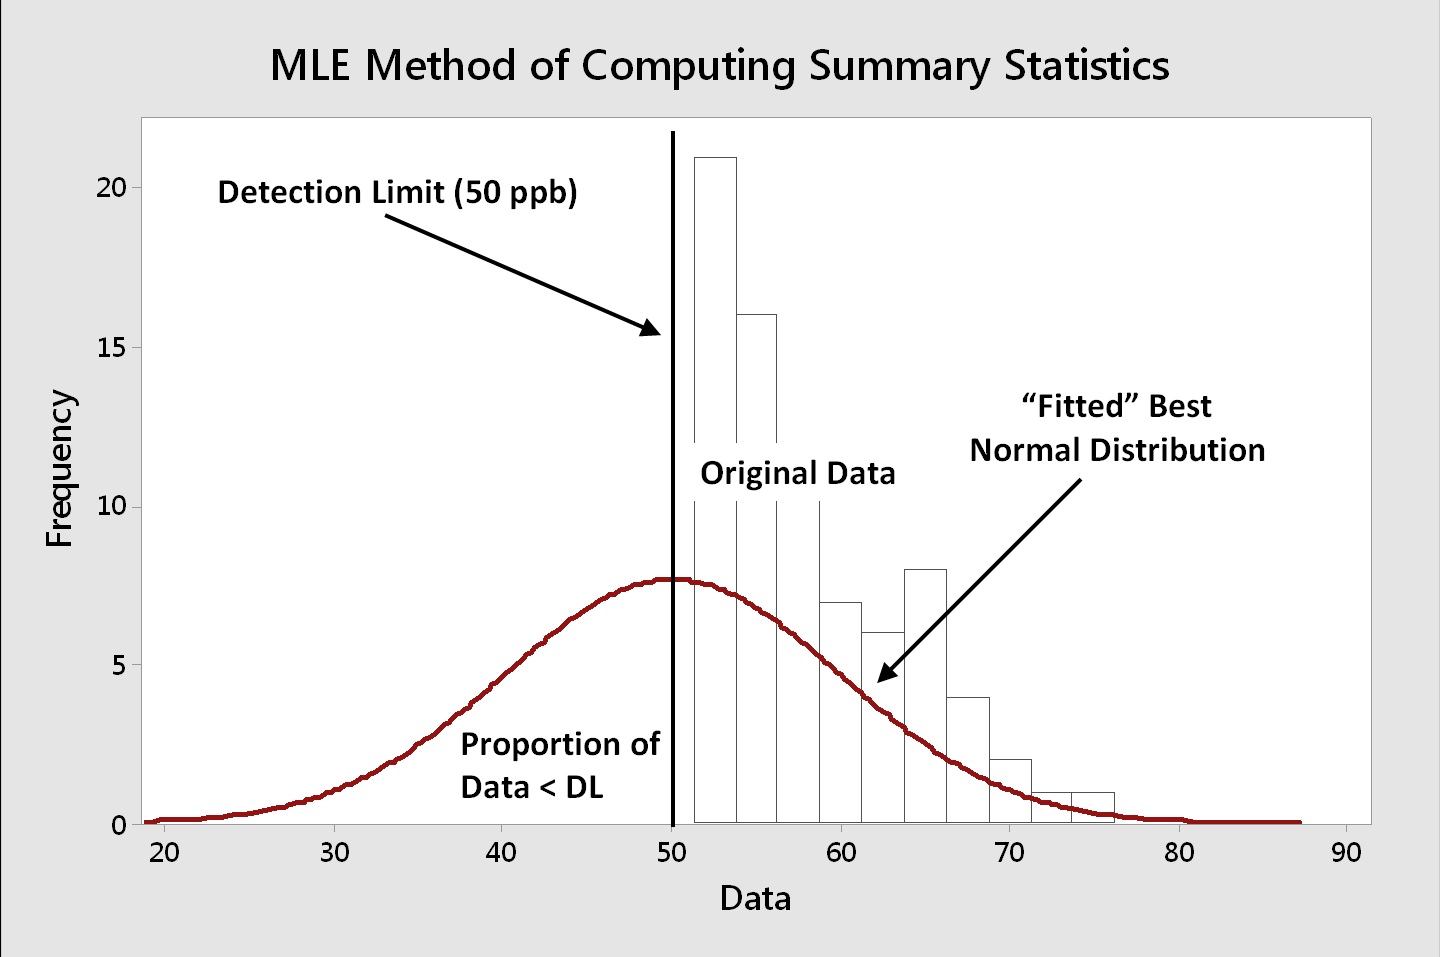
Figure 10: MLE Method of Estimating Mean and Standard Deviation - For the example in this article, the MLE would estimate the mean and standard deviations using the original data above the point of truncation (DL = 50 ppb) combined with the proportion (~50%) of the data that were below the DL.
It is important to recognize that the true distribution of any left-censored data and their characteristics are never really known. But it is reasonable to assume that all cleaning data are normally distributed, as discussed for TOC data in the previous article.2 As the original data set was normally distributed, the normal distribution was assumed for the different data sets used to analyze the substitution methods above.
To evaluate the value of the MLE for estimating the mean and standard deviation of censored data, the original data that were truncated (refer to Figure 5) were analyzed using the Parametric Distribution Analysis (Arbitrary Censoring) in Minitab, as described by Helsel,5 and the output generated by Minitab is shown in Table 5.
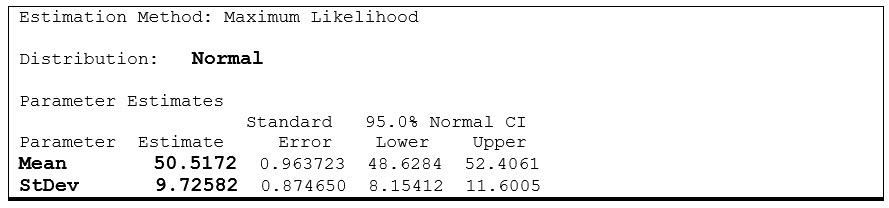
Table 5: Maximum Likelihood Estimation Results for Truncated Data shown in Figure 5
The MLE for these truncated data (Figure 5) estimated a mean of 50.5172 and a standard deviation of 9.72582 (Table 5). The mean for the original data was 50.8391 and the standard deviation was 9.41979 (refer to Figure 4), indicating a very close match with the true values.
To evaluate what impact using these MLE generated parameters would have on the process capability evaluation, another data set of 150 points was generated in Minitab using the mean (50.5172) and the standard deviation (9.72582) shown in Table 5 calculated by the MLE. Process capability analyses were then performed on the original 150 simulated data points (Figure 11) and compared to the 150 simulated data points generated using the mean and standard deviation from the MLE analysis (Figure 12).
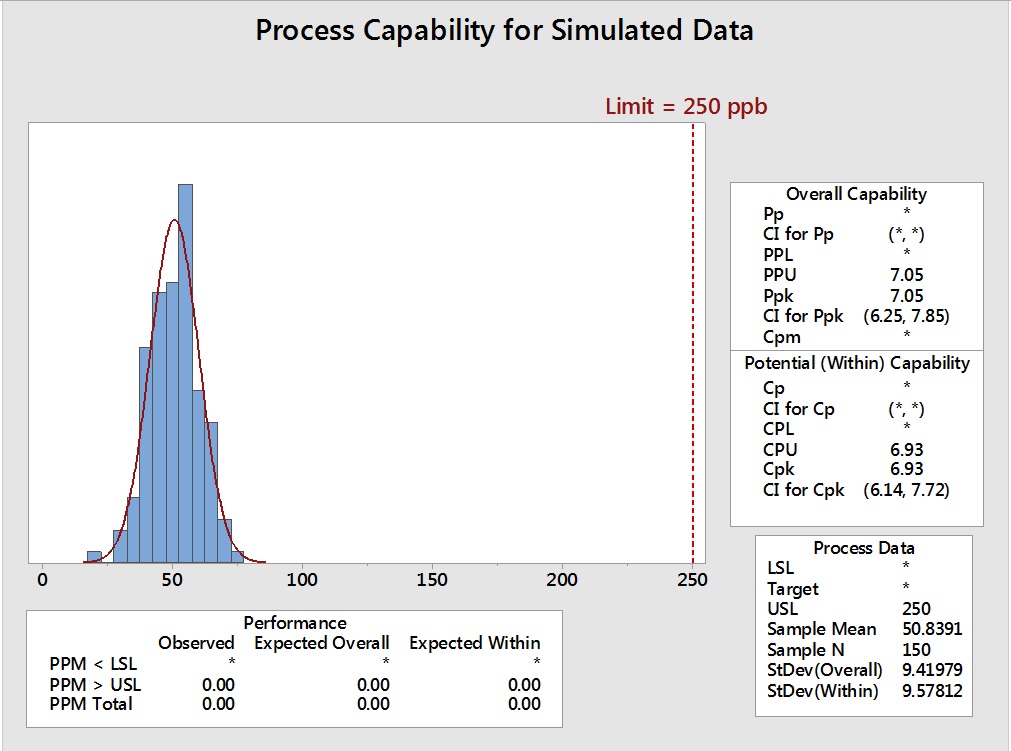
Figure 11: Process Capability of Simulated Data
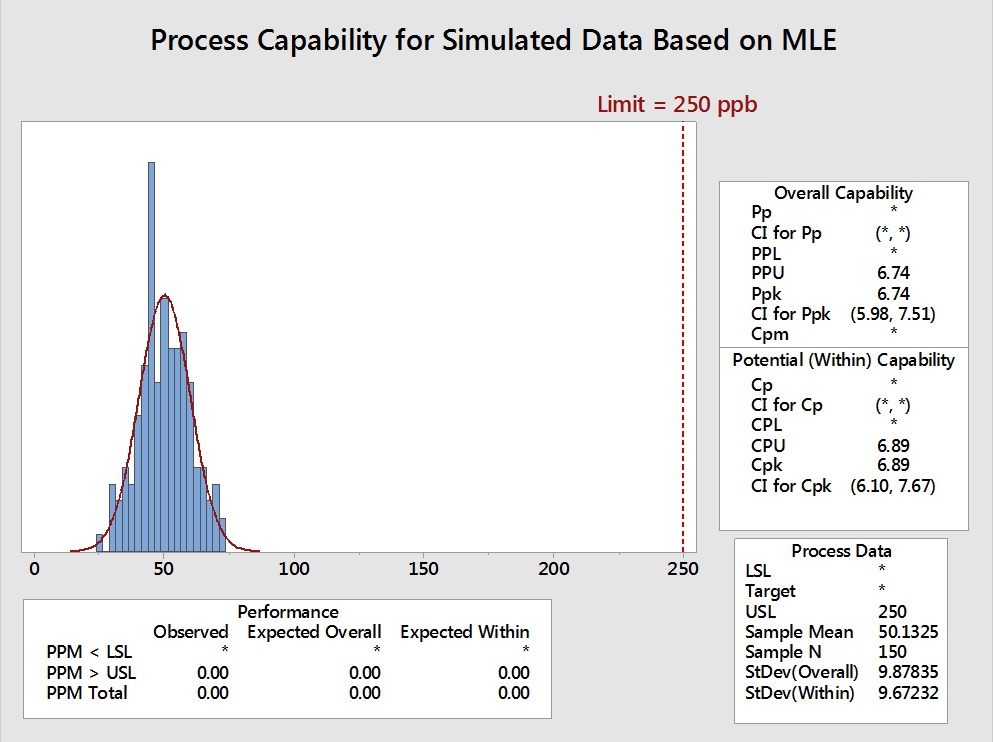
Figure 12: Process Capability of 150 Data Points Generated using the MLE Parameters
The effects of using the MLE approaches are not obvious from a visual examination of these graphs, as the MLE data very closely approximate the distribution of the original data. The Summary Statistics of these analyses are compared in Table 6.
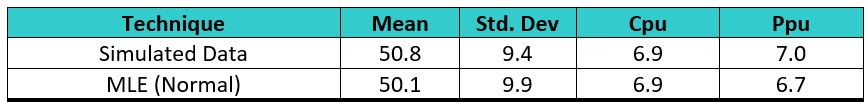
Table 6: Summary Statistics and Process Capabilities of Original Data and Data Generated based on Maximum Likelihood Estimate (Normal) - The MLE somewhat underestimated the mean and somewhat overestimated the standard deviation, but this had no effect on the calculation of Cpu and slightly affected the Ppu.
Table 6 shows that the data generated from the MLE very closely matched the original data, so it is evident that this could be a very good technique for estimating process capability of left-censored data in cleaning processes as compared to any of the substitution methods.
Maximum Likelihood Estimate: Lognormal Distribution
There have been a number of publications over the years arguing that the normal distribution should not be assumed as much as it is in the life sciences and that the lognormal distribution may actually be more representative in nature.13 Often, analytical data, which has a fundamental threshold of zero, has been analyzed using a lognormal distribution.
The lognormal distribution is an interesting distribution where the underlying data do not follow the normal distribution. Instead, it is the logarithms of these data that are normally distributed, which explains the name for this distribution. While the logarithms of lognormal data have the same two parameters as the normal distribution (μ and σ), these are not the same as the mean and standard deviation found in the normal distribution. The underlying data for the lognormal distribution are defined by three different parameters: location, scale, and threshold. Similar to the mean, the location parameter tells you where your distribution is located on the X-axis and, similar to the standard deviation, the scale parameter tells you how spread out the distribution is. The threshold is the lower boundary for the data set and, for analytical data, this would naturally be set to zero.
To evaluate the value of the MLE for estimating the location and scale of censored lognormal data, a data set of 150 lognormal data was generated in Minitab using a location of 4.0 and a scale of 0.5. Using these parameters yielded a data set that met the criteria for using MLE indicated in Table 4 (% censored of 50-80% and N≥50).
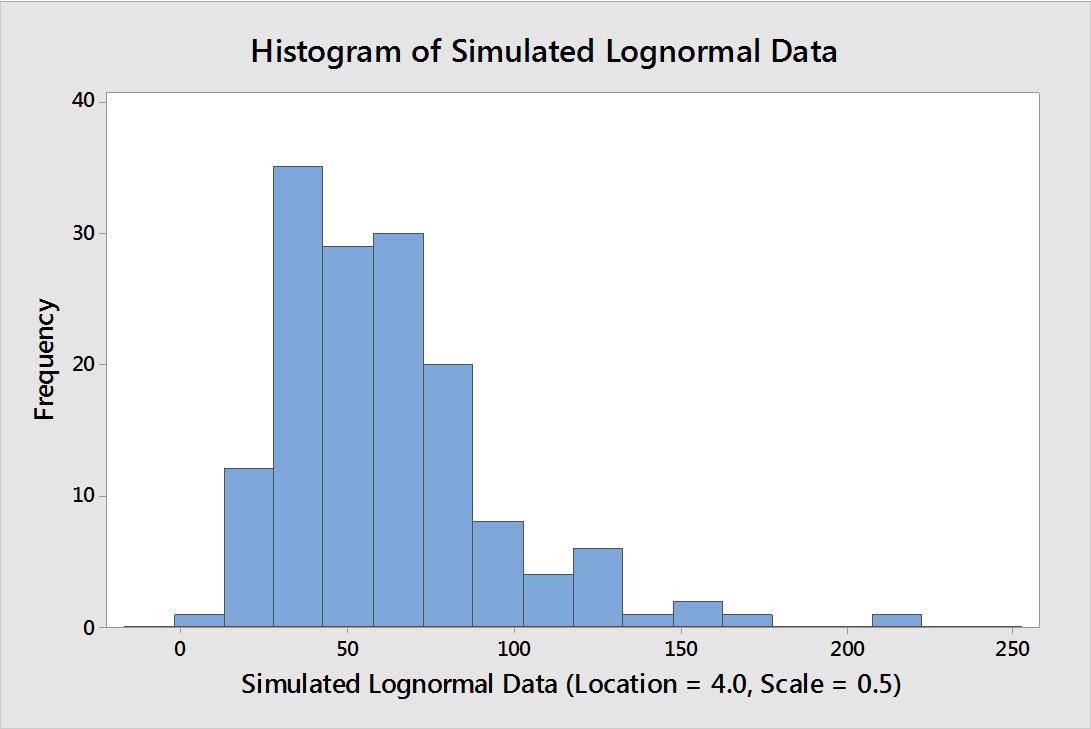
Figure 13: Histogram of 150 Simulated Lognormal Data – The simulation used a location of 4.0 and scale of 0.5, with a threshold of 0.
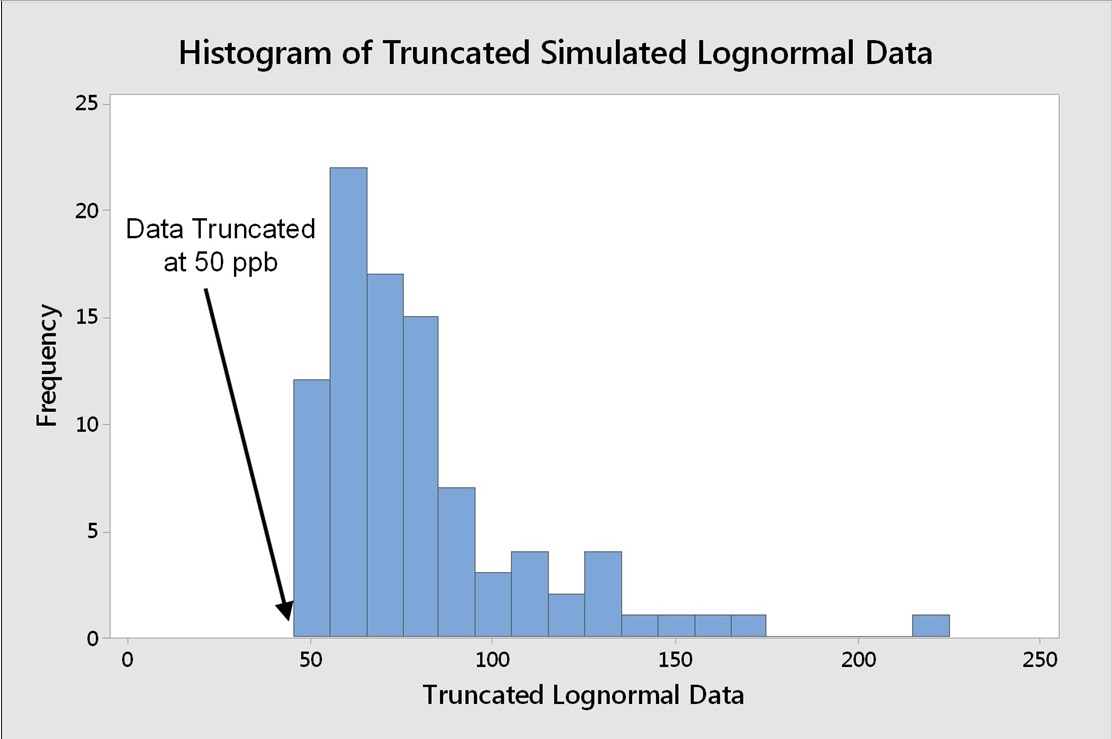
Figure 14: Histogram of 150 Simulated Lognormal Data Truncated at 50 ppb
These data were then analyzed by MLE for lognormal distributions using the Parametric Distribution Analysis (Arbitrary Censoring) in Minitab described by Helsel.5 The output generated by Minitab is shown in Table 6.
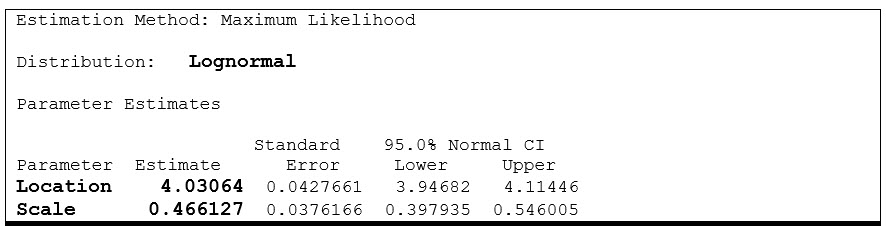
Table 7: Maximum Likelihood Estimation Results for Truncated Data shown in Figure 14
The MLE for these truncated data estimated a location of 4.03064 and a scale of 0.466127 (Table 7), which very closely match the values used to simulate the original data (location = 4.0 and scale = 0.5).
To evaluate the impact of using these MLE generated parameters would have on the process capability evaluation, another data set of 150 points was generated in Minitab using the location (4.03064) and the scale (0.466127) calculated by the MLE shown in Table 6. Process capability analyses were then performed on the original 150 simulated data points (Figure 15) and compared to the 150 simulated data points generated using the mean and standard deviation from the MLE analysis (Figure 16).
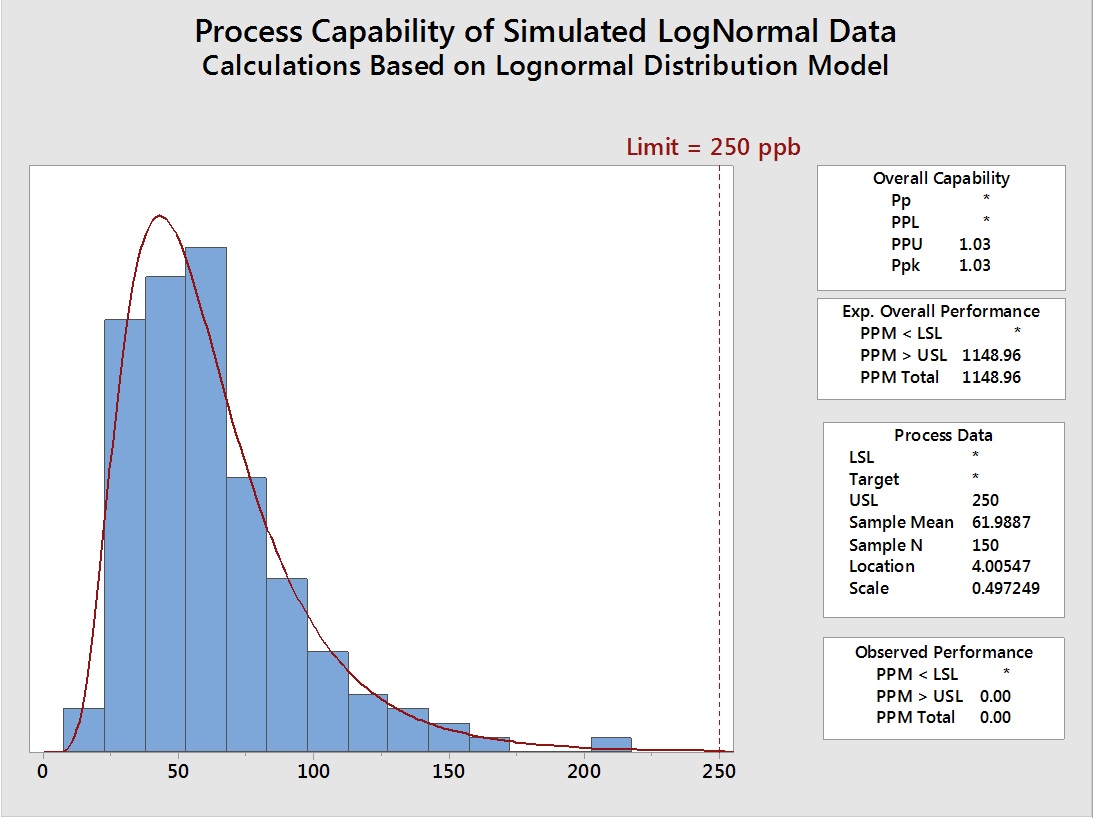
Figure 15: Process Capability of 150 Simulated Lognormal Data
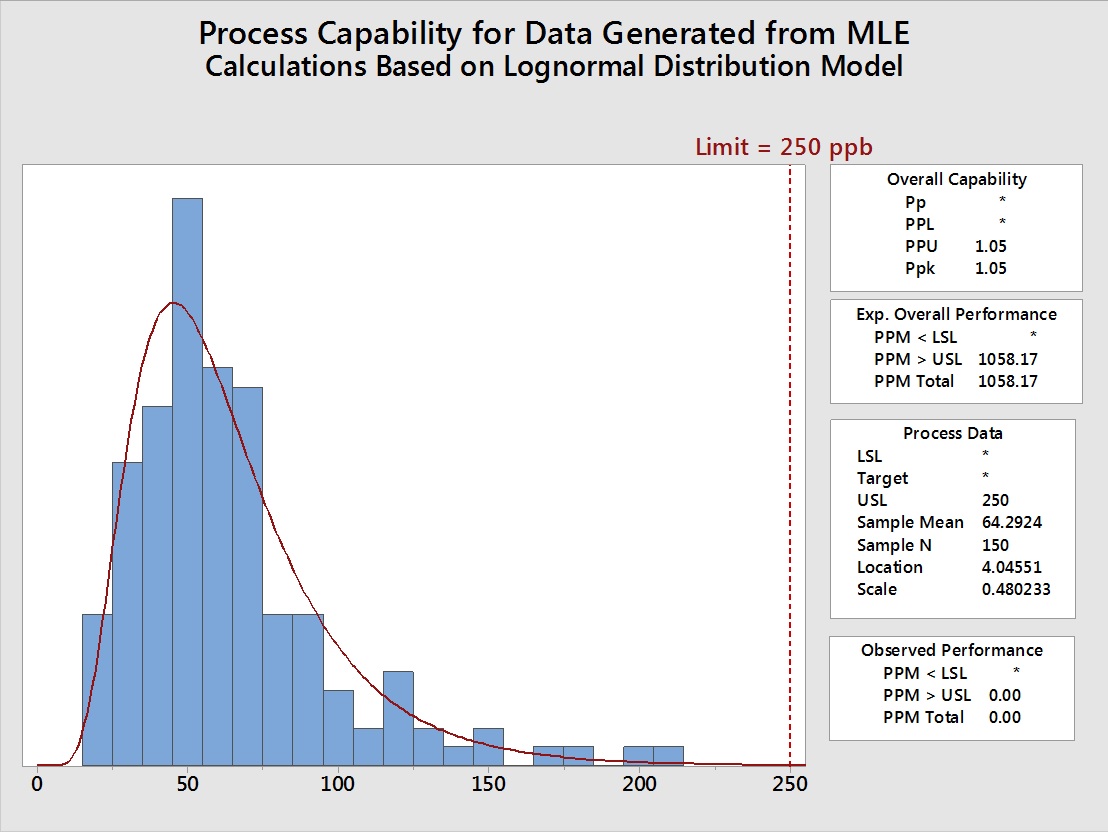
Figure 16: Process Capability of 150 Lognormal Data Points Generated using the MLE Parameters
The Summary Statistics of these analyses are compared in Table 8.
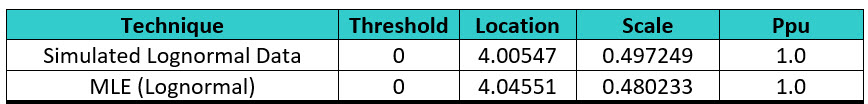
Table 8: Summary Statistics and Process Capabilities of Original Data and Data Generated based on Maximum Likelihood Estimate (Lognormal) - The MLE slightly overestimated the location and slightly underestimated the scale, but these had no effect on the calculation as the Ppu was accurately estimated
Table 8 shows that the data generated from the MLE very closely matched the original data, so it appears that this could be a very good technique for estimating process capability of left-censored data in cleaning processes, at least for data that is 5080% censored and when N ≥ 50.
These MLE techniques show promise for use in process capability analysis for censored normal and lognormal cleaning data and should be investigated further and refined for cleaning validation purposes. In particular, the effects of smaller data sets and data sets with left-censored data greater than 50% should be explored.
Summary
One of the goals of the ASTM E3106-18 Standard Guide14 was to provide a framework for implementing the FDA's process validation approach for cleaning processes. The calculation of process capability is an important part of the science- and risk-based approach to cleaning validation15-17 as it provides an objective metric of the cleaning process performance. In recent years, the evaluations of many cleaning processes have begun using TOC, which is very amenable to process capability calculations. However, HPLC has been more widely used where many left-censored data are encountered. In order for process capability to be estimated for these left-censored data, reliable methods for analyzing these data need to be identified and developed for use in cleaning validation. This article shows how techniques like MLE can be easily and successfully used to accurately estimate the process capability of cleaning processes where some of the data are left-censored. Using techniques such as these will allow the risk associated with cleaning processes analyzed using HPLC to be measured where, in the past, it was believed that process capability cannot be calculated with these data. This is an important development, as the ability to calculate process capability for cleaning processes with partially censored data allows the level of exposure to be measured15 and the level of risk to be determined.16 In the science-, risk-, and statistics-based world of ASTM E3106, the level of risk is what determines the level of effort, formality, and documentation necessary for cleaning validation.17
Our next article will discuss techniques for estimating process capability of cleaning processes where all the data (100%) are left-censored.
Peer Review
The authors wish to thank Thomas Altman; Ralph Basile; Joel Bercu, Ph.D.; Sarra Boujelben; Alfredo Canhoto, Ph.D.; Gabriela Cruz, Ph.D.; Mallory DeGennaro; Parth Desai; David Dolan, Ph.D.; Jayen Diyora; Kenneth Farrugia; Andreas Flueckiger, M.D.; Christophe Gamblin; Ioanna-Maria Gerostathes; Ioana Gheorghiev, M.D.; Igor Gorsky; Jessica Graham, Ph.D.; Hongyang Li; Ajay Kumar Raghuwanshi; Siegfried Schmitt, Ph.D.; Osamu Shirokizawa; and Ersa Yuliza for reviewing this article and for providing insightful comments and helpful suggestions.
References
- Walsh, Andrew, Miquel Romero Obon and Ovais Mohammad "Calculating The Process Capabilities Of Cleaning Processes: A Primer" Pharmaceutical Online November 2021
- Walsh, Andrew, Miquel Romero Obon and Ovais Mohammad. "Calculating the Process Capability of Cleaning Processes from Total Organic Carbon Data" Pharmaceutical Online January 2022
- American Society for Testing and Materials (ASTM) E2586 "Standard Practice for Calculating and Using Basic Statistics" www.astm.org
- Helsel, Dennis R. "More than obvious - Better Methods for Interpreting Non-Detect Data" Environ. Sci. Technol., Vol. 24, No. 12, 1990
- Helsel, Dennis R. "Less than obvious - statistical treatment of data below the detection limit" Environ. Sci. Technol., Vol. 24, No. 12, 1990
- Helsel, Dennis R., "Statistics for Censored Environmental Data Using Minitab® and R" Wiley, 2 edition, 2012
- Shoari, Niloofar, Jean-Sébastien Dubé, Shoja’eddin Chenouri "Estimating the mean and standard deviation of environmental data with below detection limit observations: Considering highly skewed data and model misspecification" Chemosphere 138 (2015)
- Shoari N, Dubé JS. Toward improved analysis of concentration data: Embracing nondetects. Environ Toxicol Chem. 2018 Mar;37(3):643-656. https://setac.onlinelibrary.wiley.com/doi/pdf/10.1002/etc.4046
- Hewett P, Ganser GH. A comparison of several methods for analyzing censored data. Ann Occup Hyg. 2007 Oct;51(7):611-32. (full text available here: https://doi.org/10.1093/annhyg/mem045)
- Helsel D.R. (2005). Nondetects And Data Analysis: Statistics for censored environmental data. John Wiley & Sons.
- Kroll, Charles N. and Jery R. Stedinger "Estimation of moments and quantiles using censored data" Water Resources Research, 1996, Vol. 32, No. 4, Pages 1005-1012
- Mustafa Agah Tekindal, Beyza Doğanay Erdoğan and Yasemin Yavuz " Evaluating Left-Censored Data Through Substitution, Parametric, Semi-parametric, and Nonparametric Methods: A Simulation Study" Interdiscip Sci Comput Life Sci (2017) 9:153–172
- Limpert, Eckhard, Werner A. Stahel, and Markus Abbt "Log-normal Distributions across the Sciences: Keys and Clues" BioScience. May 2001 / Vol. 51 No. 5
- American Society for Testing and Materials (ASTM) E3106-18 "Standard Guide for Science-Based and Risk-Based Cleaning Process Development and Validation" www.astm.org.
- Walsh, Andrew, Ester Lovsin Barle, David G. Dolan, Andreas Flueckiger, Igor Gorsky, Robert Kowal, Mohammad Ovais, Osamu Shirokizawa, and Kelly Waldron. "A Process Capability-Derived Scale For Assessing Product Cross-Contamination Risk In Shared Facilities" Pharmaceutical Online August 2017
- Walsh, Andrew, Thomas Altmann, Alfredo Canhoto, Ester Lovsin Barle, David G. Dolan, Andreas Flueckiger, Igor Gorsky, Jessica Graham, Ph.D., Robert Kowal, Mariann Neverovitch, Mohammad Ovais, Osamu Shirokizawa and Kelly Waldron "Measuring Risk in Cleaning: Cleaning FMEA and the Cleaning Risk Dashboard" Pharmaceutical Online, April 2018
- Walsh, Andrew, Thomas Altmann, Ralph Basile, Joel Bercu, Ph.D., Alfredo Canhoto, Ph.D., David G. Dolan Ph.D., Pernille Damkjaer, Andreas Flueckiger, M.D., Igor Gorsky, Jessica Graham, Ph.D., Ester Lovsin Barle, Ph.D., Ovais Mohammad, Mariann Neverovitch, Siegfried Schmitt, Ph.D., and Osamu Shirokizawa, Osamu Shirokizawa and Kelly Waldron " The Shirokizawa Matrix: Determining the Level of Effort, Formality and Documentation in Cleaning Validation" Pharmaceutical Online, December 2019.