
Calculating The Probability Of Passing The USP Dissolution Test
By Prasanth Sambaraju

Dissolution testing is performed to provide in vitro drug release information and to accurately predict the in vivo drug release. Dissolution tests are performed at different stages of the drug manufacturing process to ensure that the drug product meets the standards as specified in the United States Pharmacopoeia (USP). USP provides requirements for sampling, testing, and acceptance criteria for tests like content uniformity and dissolution.1,2 A manufacturing process is said to be in regulatory compliance only if it meets the acceptance criteria for all the tests specified in USP. To ensure there is a high probability of passing these tests, sponsors establish in-house specification limits to ensure there is a high probability of meeting these acceptance criteria. Different methods are reported in the literature to calculate the probability of passing the dissolution test. One of the reported methods3 to estimate the probability of passing the USP dissolution test uses Mathematica software for calculation. The goal of this article is to calculate the probability of passing the USP dissolution test from that method using Microsoft Excel.
USP Dissolution Test For Immediate-Release Dosage Forms
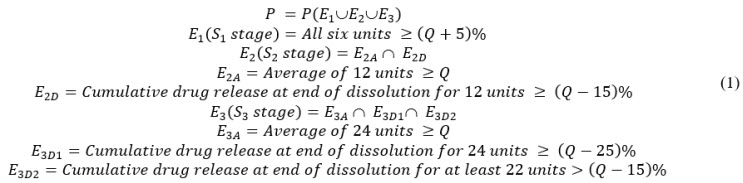
If the acceptance criteria at stages 1, 2, and 31,3,4 are described by the events E1, E2, and E3, respectively, then the probability of passing the USP dissolution test is given by:
Method
The probability of passing the USP dissolution test as proposed is given by Wang3 and Chiang et al.:4

Where each term in the equation can be estimated as follows:
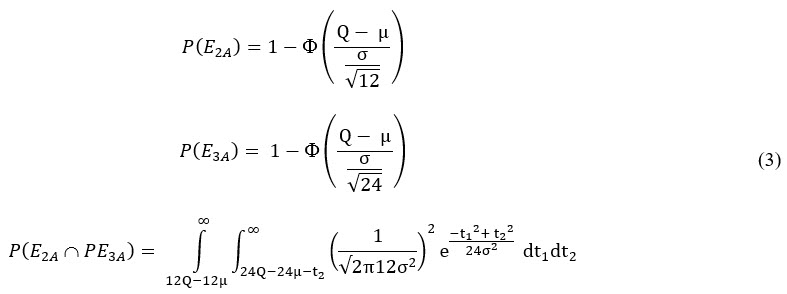

Formulas Used In Excel Spreadsheet
The formulas used in the Excel spreadsheet are explained in Table 1 below.
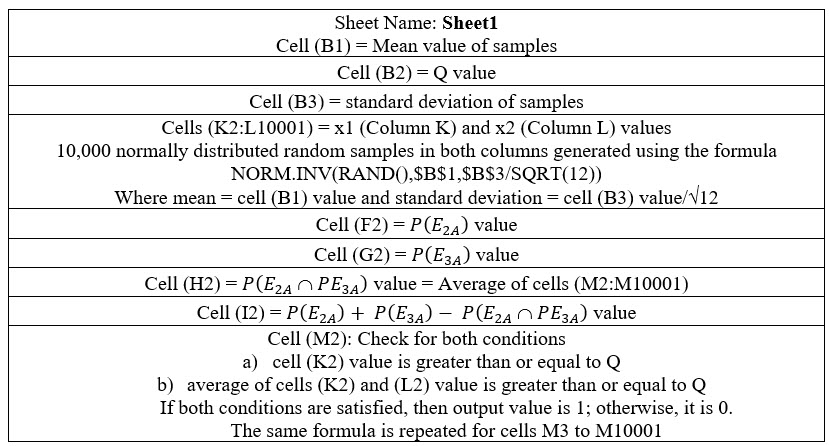
Table 1: Formulas used in Excel spreadsheet
Results
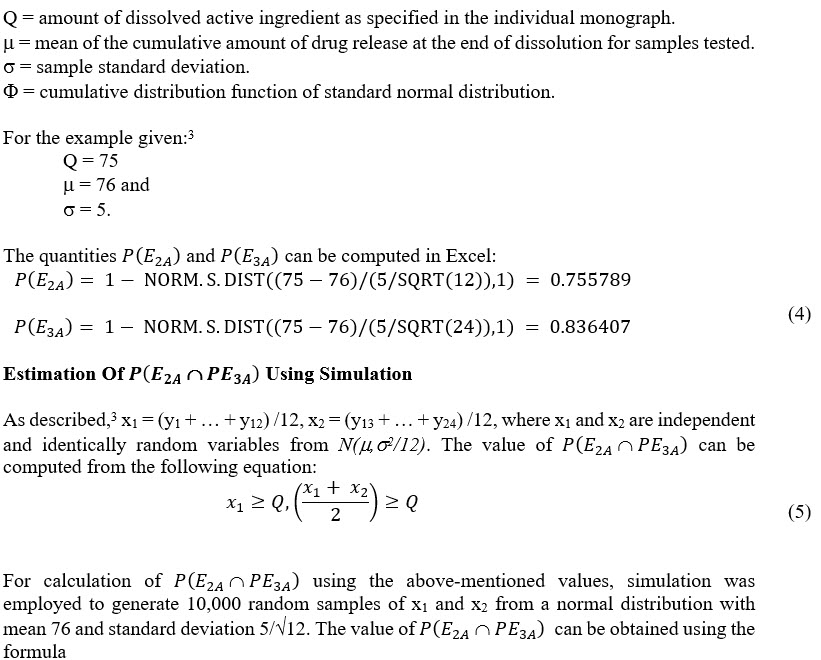
The accuracy of the above method was tested by comparing the results obtained from this method with reported values. The Microsoft Excel file used to calculate the probabilities at different standard deviation, mean, and Q values is included as supporting information.
The mean of dissolution was 75 and Q was 75: The computed values are in agreement with the reported values3 and are given in Table 2 below.
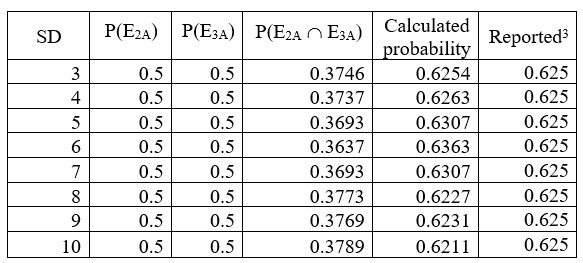
Table 2: Comparison of calculated and reported values (Mean 75 and Q 75)
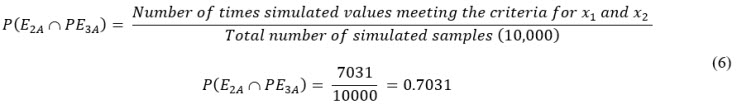
The mean of dissolution was 80 and Q was 75. In this case, a higher number of simulated values are required so that the final probability doesn’t exceed 1. The results are given in Table 3 below.
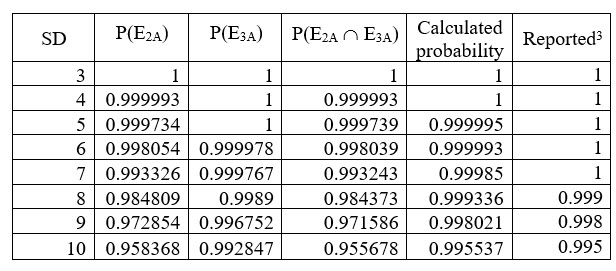
Table 3: Comparison of calculated and reported values (Mean 80 and Q 75)
Conclusions
The results obtained using the Excel spreadsheet approach are comparable to reported results.3 The spreadsheet can be modified for any combination of Q, mean, and standard deviations values, and is an easy and accurate way for industry members to calculate the probability.
References
- USP<711>. https://www.usp.org/sites/default/files/usp/document/harmonization/gen-method/stage_6_monograph_25_feb_2011.pdf. Accessed November 29, 2022.
- Chow SC, Shao J, Wang H. Probability lower bounds for USP/NF tests. J Biopharm Stat. 2002;12(1):79-92. doi:10.1081/bip-120005781
- Wang H. Estimation of the probability of passing the USP dissolution test. J Biopharm Stat. 2007;17(3):407-413. doi:10.1080/10543400701199536
- Chiang C, Chen CF, Huang MY, Liu JP. An inferential procedure for the probability of passing the USP dissolution test. Pharm Stat. 2012;11(1):32-38. doi:10.1002/pst.492
 About The Author:
Prasanth Sambaraju is an independent researcher based in Hyderabad, India, with research interests on applications of computational techniques within the pharmaceutical industry. He can be reached at prasanth.sambaraju@gmail.com