
How To Establish The Number Of Runs Required For Process Validation
By Mark Durivage, Quality Systems Compliance LLC
The first article in this series, Risk-Based Approaches To Establishing Sample Sizes For Process Validation (June 2016),  provided and established the relationship between risk and sample size. Subsequent articles have introduced different methods for determining sample sizes to ensure validation activities will yield valid results. This article will demonstrate the how to establish the number of runs required for process validation.
U.S. Food and Drug Administration (FDA) regulations, International Organization for Standardization (ISO) standards, and Global Harmonization Task Force (GHTF) guidance documents do not prescribe the number of runs required for process validation activities. Industry has typically used three batches during the process performance qualification (PPQ) phase to demonstrate that a process is capable of consistently delivering quality product.
However, the "rule of three" batches or runs is no longer appropriate for process validation activities. FDA’s guidance for industry Process Validation: General Principles and Practices (2011) recommends that a PPQ protocol should include the sampling plan, “including sampling points, number of samples, and the frequency of sampling for each unit operation and attribute. The number of samples should be adequate to provide sufficient statistical confidence of quality both within a batch and between batches. The confidence level selected can be based on risk analysis as it relates to the particular attribute under examination. Sampling during this stage should be more extensive than is typical during routine production.”
Even those with a limited knowledge of statistics will recognize that a run of three is not statistically significant. And those who have a mastery of statistical techniques already know that a sample of three is not significant. If a manufacturer were to use the success-run theorem to determine the number of process validation runs, using 95% confidence and 90% reliability, it would require 30 runs. However, 30 runs is neither practical nor cost effective. Additionally, some products may be produced only occasionally.
Using a DOE Scheme to Justify PPQ Runs
One method that can be used to justify the number of PPQ runs is based upon the design of experiments (DOE) used to identify and characterize the process parameters. Generally, a screening DOE will be used to separate the “vital few from the trivial many” (Pareto analysis). For example, a machine has seven parameters that can be set, and each setting has two levels. A full factorial DOE would require 27 = 128 runs to fully determine the main effects and interactions. The same 27 run as a fractional factorial would require eight runs. However, with eight runs, interactions will not be identified.
Using the example, a machine has seven parameters that can be set, and each setting has two levels (27 128 runs). The engineering team decided to use a fractional factorial experiment that requires eight runs. The result of the experiment indicated that factors A, B, and C were significant. (Factors D, E, F, and G were insignificant.) To further explore the effects of factors A, B, and C, the team will run a full factorial 23 experiment, which requires eight runs. The results of the 23 experiment are shown in Figure 1.
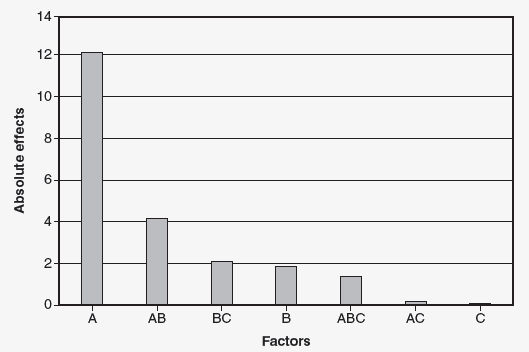
Figure 1: Pareto chart of the absolute values of the effects
Factor is significant. The interaction AB is also significant. Due to the hierarchy of model rule, factor B is also included. We have now gone from a 27 fractional factorial with eight runs to a 22 full factorial experiment requiring four runs. Due to the hierarchy of model rule, factors A and B must be used. Four runs could now be justified for the number of PPQ runs.
Note: Factors C, D, E, F, and G are not significant and can be set solely based on cost, productivity, or convenience.
Shifts and Suppliers Scheme
The purpose of PPQ runs is to establish that a process is capable of consistently delivering quality product by introducing as much variation into the process as is expected during production operations. The two main sources of variation (disregarding the process itself) will relate to the number of shifts producing the product and the number of suppliers suppling a particular raw material or component used in the production process (i.e., two suppliers suppling a key chemical or component).
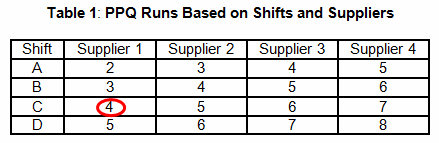
Table 1 provides an example that uses a shift and supplier scheme to determine the number of required PPQ runs. For example, a manufacturing facility maintains three shifts and uses a sole supplier for each chemical used in a blending process. According to Table 1, four PPQ runs will be required. It should be obvious that this method is risk-based and not statistically based or statistically significant.
FMEA Scheme
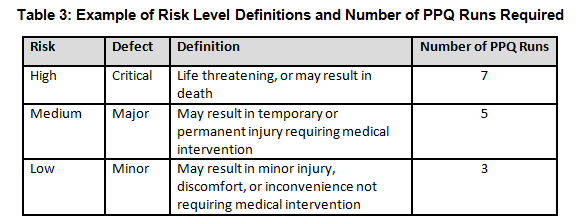
Before we begin, we must establish our definitions of risk and the minimum required number of PPW runs. These definitions can and should vary based upon organizational needs. A good place to determine the risk level is from the failure modes and effects analysis (FMEA). FMEA (design, process, user) is a systematic group of activities designed to recognize, document, and evaluate the potential failure of a product or process, and its effects. FMEA uses a risk priority number (RPN), which is comprised of frequency, detection, and severity. The higher the RPN, the higher the risk. However, a high severity in conjunction with a low probability of occurrence and high probability of detection may still necessitate the appropriate controls for high risk. Figure 2 depicts an example FMEA with the associated risk levels. Once the risk level has been determined (low, medium, high), the appropriate number of PPQ runs can be selected.
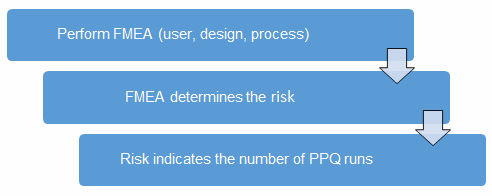
Figure 2: Risk process for determining the appropriate number of PPQ runs
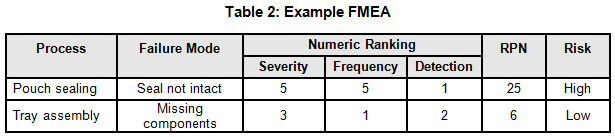
Table 3 shows an example of risk level definitions with accompanying defect classifications. These definitions can and will vary based upon the product(s) produced and their intended and unintended uses.
Demonstrating Statistical Confidence Between Runs
Demonstrating sufficient statistical confidence between runs can be accomplished using the non-parametric Kruskal-Wallis test and Levene’s test. These tests will help determine if there is sufficient evidence to conclude whether two or more means or variances respectively are equal with a significance level α (usually 90%, 95%, or 99%). Both tests allow the use of unequal sample sizes. Please be aware that the original data must pass the stated validation criteria to perform these tests.
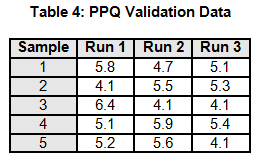
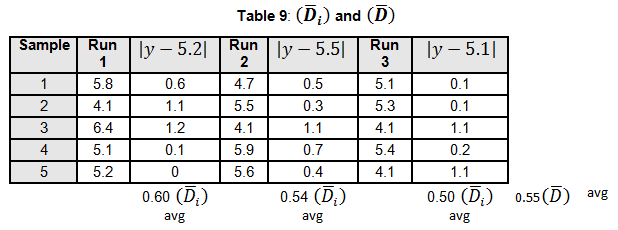
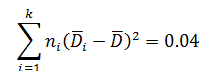
A manufacturing process is being validated. The validation team determines that three PPQ validation runs would be necessary based upon the risk assessment. The data for the three PPQ validation runs is shown in Table 4. The non-parametric Kruskal-Wallis Means Test and Levene’s Variance Test will be used to assess if there is sufficient evidence to conclude whether the means and variances are equal with a significance level α 95%.
Note: Each run only has five data points, to simplify the example calculations.
Kruskal-Wallis Test
The Kruskal-Wallis test is a non-parametric test used to determine if two or more samples originate from the same distribution by evaluating the means. The Kruskal-Wallis test assigns ranks to the data points, replacing the original data points. The test statistic KW is compared a critical 󠇢□Χ2 value to determine if:
H0: μ1 = μ2 =…= μk or HA: μi ≠ μk for at least one pair.
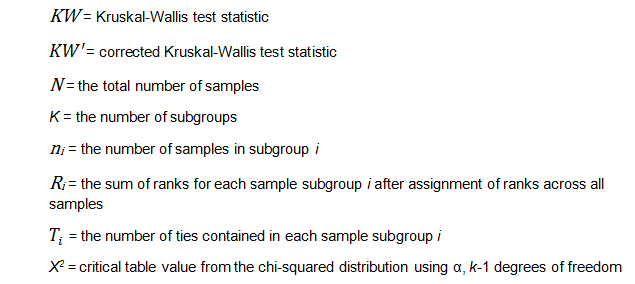
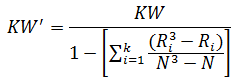
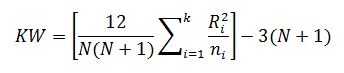
The Kruskal-Wallis test statistic (KW) is calculated using:
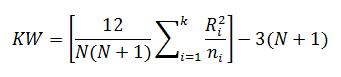
Where:
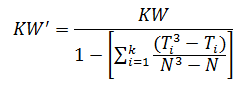
When there are many ties (≈50% or greater), a correction factor for KW is made by:
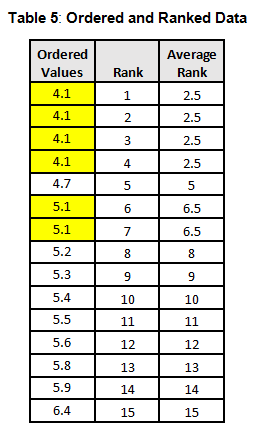
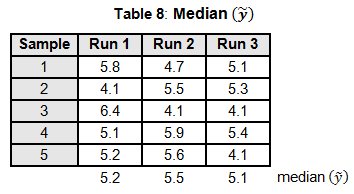
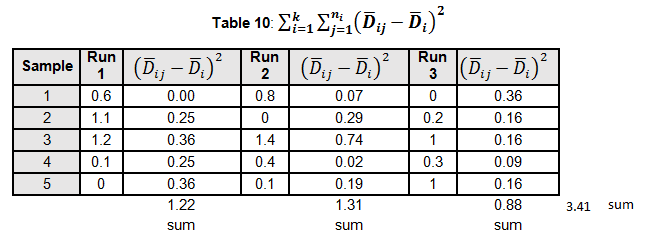
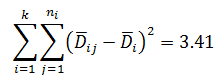
To calculate the KW test statistic, we must order the data points from Table 4 and assign ranks to each value. When values are repeated, the average rank is assigned (see the highlighted values in Table 5).
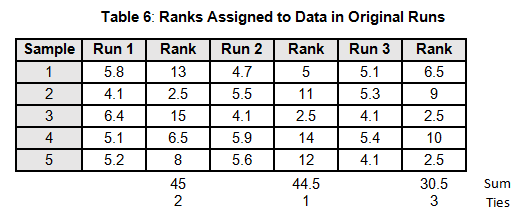
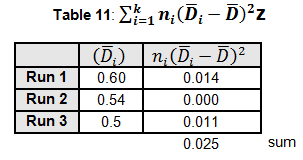
The average ranks are then assigned to the data in the original runs (see Table 6).
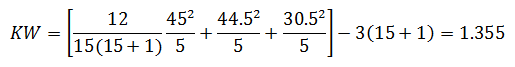
For the purpose of this example, we will calculate KW'
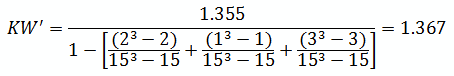
The critical chi-squared distribution value is found using α and k-1degrees of freedom. For this example, α of 0.05 will be used.
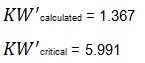
Since KW' calculated is less than KW' critical at the 0.05 α (alpha) level, there is insufficient evidence to reject the null hypothesis that H0: μ1 = μ2 = μ3. Therefore, we have demonstrated sufficient statistical confidence for the validation runs (for the means). Please note that if KW (1.355) was used, the conclusion would be the same.
Still have questions? Get advice directly from Mark in his webinar:
How to Establish the Number of Runs Required for Process Validation
Levene’s Test
Levene’s test is a non-parametric test used to determine if two or more samples have the same variance. The Levene’s test uses deviations replacing the original data points. The test statistic L is compared a critical 󠇢□F value to determine if:
H0: σ1 = σ 2 =…= σ k or HA: σ i ≠ σ k for at least one pair
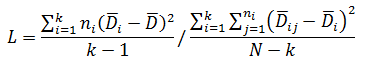
Where:
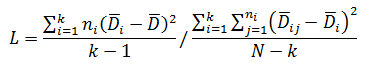
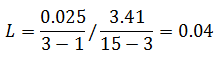
The critical F distribution value is found using α,(df1 = k - 1), (df2 = n – k). For this example, α of 0.05 will be used.
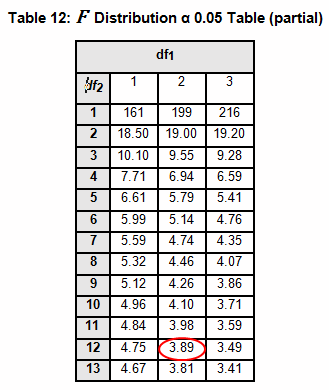
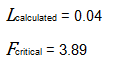
Since L calculated is less than F critical at the 0.05 α (alpha) level, there is insufficient evidence to reject the null hypothesis that H0: σ1 = σ2 = σ3. Therefore, we have demonstrated sufficient statistical confidence for the validation runs (for the variances).
The examples provided used three runs with five data points each. If a PPQ required five runs each with 60 data points, the calculations will quickly become very cumbersome. Hopefully it is apparent that the use of spreadsheets and statistical software will facilitate the calculations for the Kruskal-Wallis and Levene’s tests.
Choosing the Right Requirements for your Process
I want to reinforce that selecting the number of PPQ runs should be based upon an organization’s risk acceptance determination threshold, industry practice, guidance documents, and regulatory requirements.
Additional considerations should be reviewed and justified for “family of parts.” Choosing the worst case, and providing why the selected items are worst case, is extremely important.
Validation activities should be supported by laboratory testing (physical and analytical), continuous process monitoring; first article layouts (FAL); first article inspections (FAI); design of experiments (DOE); test method validation (TMV); measurement systems analysis (MSA); incoming, in-process, and final (release) inspections; calibration; and training. A sound sampling scheme will help demonstrate sufficient statistical confidence of quality both within a run and between runs. Validation activities should not be performed in isolation, but rather as part of a process supported by the activities just listed.
This article series has introduced several different methods for establishing sample sizes for process validation. The articles in the series include:
- Risk-Based Approaches To Establishing Sample Sizes For Process Validation
- How To Establish Sample Sizes For Process Validation Using The Success-Run Theorem
- How To Use Reliability-Based Life Testing Sampling For Process Validation
- How To Establish Sample Sizes For Process Validation Using C=0 Sampling Plans
- How To Establish Sample Sizes For Process Validation Using Statistical Tolerance Intervals
- How To Establish Sample Sizes For Process Validation Using Variable Sampling Plans
- How To Establish Sample Sizes For Process Validation Using LTPD Sampling
- How To Establish Sample Sizes For Process Validation When Destructive or Expensive Testing Is Required
References:
- Durivage, M.A., 2016, Practical Design of Experiments (DOE), Milwaukee, ASQ Quality Press
- Durivage, M.A., 2014, Practical Engineering, Process, and Reliability Statistics, Milwaukee, ASQ Quality Press
- Durivage, M.A. and Mehta B., 2016, Practical Process Validation, Milwaukee, ASQ Quality Press
- Durivage, M.A., 2016, Risk-Based Approaches To Establishing Sample Sizes For Process Validation, Life Science Connect
- FDA Guidance for Industry: Process Validation: General Principles and Practices. FDA online. Accessed December 27, 2016. http://www.fda.gov/downloads/Drugs/Guidances/ UCM070336.pdf.
- The Global Harmonization Task Force (GHTF). 2004. SG3 Quality Management Systems— Process Validation Guidance. 2nd ed. GHTF.
About the Author
 Mark Allen Durivage is the managing principal consultant at Quality Systems Compliance LLC and an author of several quality-related books. He earned a B.A.S. in computer aided machining from Siena Heights University and a M.S. in quality management from Eastern Michigan University. Durivage is an ASQ Fellow and holds several ASQ certifications including CQM/OE, CRE, CQE, CQA, CHA, CBA, CPGP, and CSSBB. He also is a Certified Tissue Bank Specialist (CTBS) and holds a Global Regulatory Affairs Certification (RAC). Durivage resides in Lambertville, Michigan. Please feel free to email him at mark.durivage@qscompliance.com with any questions or comments, or connect with him on LinkedIn.