
"Human Error" Deviations: How You Can Stop Creating (Most Of) Them
By Ben Locwin, Ph.D.
 Them")
The global pharmaceutical market is currently around $1,000 billion (Statista, 2017). That’s $1 trillion annually. Just in the United States, the pharma manufacturing gross output is about $207 billion (see Figure 1 below).
A lot of production processes lead to the level of output shown above. And there are a lot of people across the world working to produce effective and safe medicines. The top 10 pharmaceutical hubs in the U.S. alone employ more than 1.1 million people (ProClinical, 2016). That’s a lot of human error! Or is it?
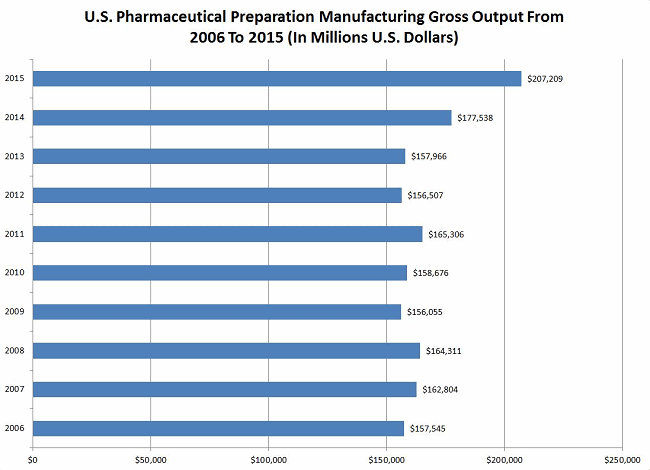
Figure 1: U.S. pharmaceutical preparation manufacturing gross output from 2005 through 2015 (Source: Statista, 2017).
How Many?
 Manufacturing sites typically generate an average of just over 1,000 deviations per year, which is, of course, a function of many factors, including size of the facility, numbers of product changeovers, numbers of new processes, and types of manufacturing processes. There are tens of millions of pharma deviations per year across the globe (a number no one has accurately characterized to date, but is estimated at between 10 million and 70 million total per year across all production sites).
In the time it takes you to read this article (estimated at 6 to 8 minutes, based on a sample of n=12 test readers), the industry will generate (conservatively) about 115 new process deviations, and about 65 (standard deviation of 15) of them will be misclassified as having something related to “human error” as either the principal causal factor or one of the proximal causal factors. And it just isn’t true.
If you work within the operations functions where these deviations are being generated, the deviation oversight process, quality review of deviations, or some part of the corrective and preventive action (CAPA) creation or approval process, stop being complicit in allowing the systems to blindly progress these erroneously handled records. If people keep making the same sorts of errors in the same scenarios, it’s a system problem. And system problems are the responsibility of management to improve.
Disambiguating “Human” Error
I have often been asked to review quality systems data to identify trends that have eluded detection, and I can tell you this often leads me to personally observe error-prone areas in the facility and overly deviation-heavy processes. I’m looking for how the work is done. What’s documented in the SOPs? How is the environment set up? What are the external distracting factors? Talk to the operators and analysts personally. Are there certain parts of the process that are hard to do? Why? Do they have to use “tribal knowledge” to actually get the process to work right (circumventing the SOPs and batch records)? This last question is incredibly important. Immediate reaction might be to shake one’s head hearing that governing documents weren’t followed, but that’s a very naïve and uninformed reaction. From a human behavior point of view, the personnel are trying their best to accomplish the end goal(s). If they need to jury-rig an instrument or consumable to make the process work, they’ll do it. This creative performance should be embraced (as long as it is implemented in a systematized manner), because when you identify where it is occurring, these innovations can be codified so the processes perform more effectively in the future. That’s why you need to:
Have A “No-Blame" Culture
It used to be that between about 85 and 90 percent of deviations generated in our industry were classified as having to do with human error, so we should pause to reflect on some of the positive changes that have occurred evolutionarily over the past two-and-a-half decades. Now that about half of the deviations currently generated in the industry are documented as being due to human error (56 percent, SD 31 percent)*, we’ve made some significant progress. But misclassification still wastes billions of dollars annually and applies companies’ resources and time to doing things that aren’t helpful for actually improving production performance.
One of the best ways to immediately improve a quality-minded outlook on your business is to realize a vast majority of deviations are not human error. In fact, process management expert W. Edwards Deming (who worked across dozens of disparate industries) estimated human error accounted for 10 percent or less of process issues. So selecting a tick box that says “human error” in your TrackWise dropdown (or other format) is not helping your cause, nor is it improving quality or compliance.
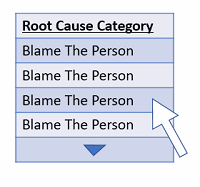
Figure 2: It sometimes feels like root cause dropdown lists were designed like this.
Note: Simply “cataloguing” and “assigning cause” to a defect or error is not compliance. Compliance presumes systems and processes are designed to adhere to regulatory pronouncements. Selecting “human error” from a dropdown list and assigning it as root cause means that user is accountable for having thoroughly investigated the causal factors of the error or defect, identifying and determining which root causes(s) are most likely, according to the preponderance of evidence, to have been associated with the defect. This means the person selecting the root cause has actually performed 5 Whys, fishbone diagram analysis, human factors analysis, fault tree analysis, and/or many other tools for actually determining root cause(s).
Because it’s probably unlikely that the real cause of the deviation was human error, it makes sense to adopt the lean manufacturing principle of a no-blame culture. Use an error as an opportunity for elevating your company’s problem-solving processes; don’t think of it as an annoyance that must be rapidly misclassified and pushed into the deviation process black box.
Backlogs, Queues, And "Black Boxes”
Here’s another observation: Deviations don’t all just happen spontaneously. And the job of the deviation function is not to reduce the processing time of deviations as a main goal (thus presumably demonstrating improved performance).

Figure 3: Author’s note: No call center employees have ever smiled this much — they’re dealing with angry repeat callers!
It used to be that call center metrics would include a measure of how quickly the call could be closed (time-to-close). That metric never took into account how many angry customers had to call back because the call wasn’t resolved by the agent the right way the first time (RFT, a metric which surprisingly isn’t used at every company for certain processes).
Rapid closure of inaccurate deviations doesn’t bespeak a deviation process that’s efficient. A much better metric is a reduction trend in total deviations over time. The size of the backlog and closure times are functions of each other and adhere to calculus of queuing theory. Inspectors should identify deficiencies within a company’s deviation system, and this is the preferred method now. The lack of a backlog can be quickly attributed to overt “brute force” methods if an inspector chooses to look at closure trends (time-to-close, dates of closures). Isn’t it funny how many organizations’ deviation backlog is reduced by 20 percent or more in the weeks leading up to a regulatory inspection? Agencies should make such observations a key component of a health measure of the quality management system.
Data Analysis expert, Dr. Ben Locwin, provides the working knowledge you need to identify repeat data errors and defects that are sapping your resources and revenues.
Data Integrity: Why Not Identifying Repeat Defects In Your Data is Killing Your Performance
If you want to actually be better, appropriate selection of root cause(s) begets the ability to choose appropriate CAPA. Appropriate CAPA make your problems go away. Well-designed CAPA should not only correct the defect, but prevent it from ever occurring again. If your repeat problems aren’t going away, you have no business calling what you’re assigning “CAPA:” the “PA” stands for “preventive action” (not “prevenTAtive,” BTW). If you’re not preventing problems, you’re not “doing” CAPA. Full stop.
Look at your quality metrics. See where you stand with this at the moment. Don’t have a reliable way to quickly identify repeat issues across areas and functions to do this assessment? That’s another problem which needs to be addressed.
How To Get Better At This?
The deviation function needs to work with operations and quality to problem-solve by choosing correct and appropriate CAPA, and then, over time, accurately characterized deviations lead to installing systemic process improvements that prevent future occurrences of problems.
Some tools you must use:
5 Whys
If you think a problem occurred because of x, ask yourself why x happened. This leads you to consider y. Then ask why y happened, until you get to a place where you have a systemic issue to address.
Like this:
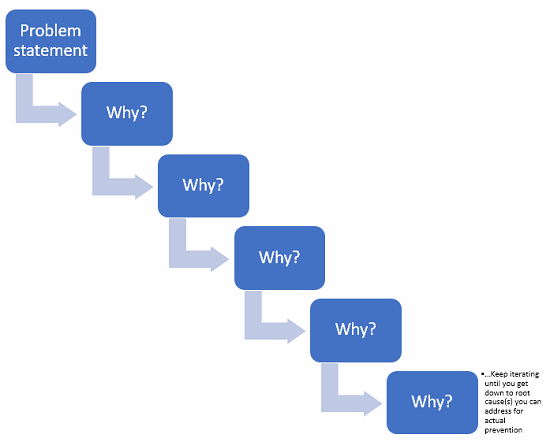
Figure 4: Example of 5 Whys
For example: “Operator transcribed production code incorrectly into batch record from source.” Just documenting the deviation like this in the short description automatically biases every other person who reviews it in the chain of processing. This is identical to prejudging an alleged criminal suspect. The behavioral neuroscience underpinning this loaded statement is complex.
Instead, a description to start the investigation such as “Production code was incorrectly transcribed into batch record on [ddmmmyy],” allows a less-biased commencement of a root cause analysis. This naturally leads to better investigation, with questions such as, “Why was the production code incorrectly transcribed?”
“Because it is 12 characters long and we request manual transcription.”
“Why is it 12 characters long?” and “Why do we request manual transcription?”
“Because that’s what we’ve been using” and “Because we don’t have an automated system to enter these data without errors.”
Which could lead you to potential corrective and preventive actions such as: Eliminate this step if it’s not absolutely required, shorten the organization’s production codes to reduce repeat deviations (12 characters in length for a code with 10 digits and 26 letters for each character gives you 4,738,381,338,321,616,896 possible combinations of production numbers … I’m sure you could function with fewer available options).
Fishbone Diagram
Also called “Ishikawa diagram” for its progenitor, Kaoru Ishikawa, if you suspend your disbelief for just long enough, it looks like the skeleton of a fish. You put the problem statement at the “head” of the fish, and the causal factor categories as the “ribs” (remember, fish have cartilage, not bone, so these categories can be adjusted to suit your needs). By having a working group list causal factors under each category, you begin to develop a visual of how many things could contribute to your main effect (the problem statement).
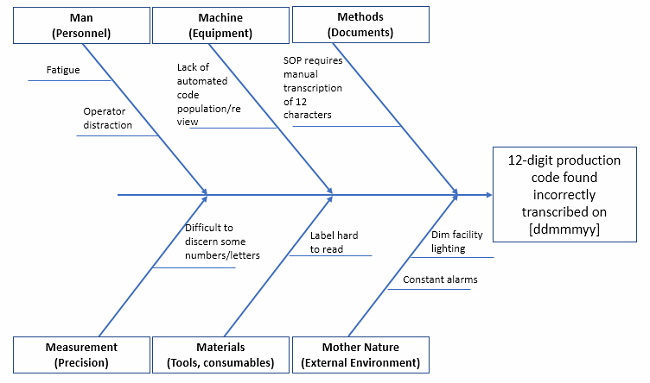
Figure 5: Fishbone diagram example (not exhaustive!)
Pro tip: Put a very detailed problem statement in the head, because this helps eliminate scope creep of the team’s discussions. What happened? When? Where? These can help narrow the focus to that which is solvable.
Fault Tree Analysis
The fault tree is what I’ve called “The visual analog of the 5 Whys” because it allows you to drill down into the causal factors to look for root cause, but, expanding beyond the 5 Whys, this tool allows you to see where bifurcations occur in causality (i.e., typically there are a couple to several reasons acting in tandem as to why a particular thing went wrong, so you can capture all of them).
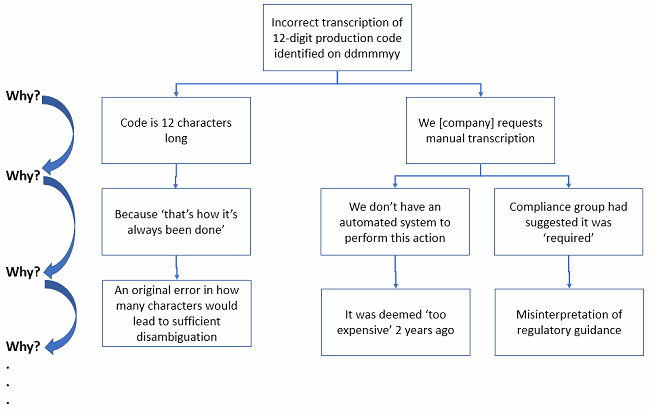
Figure 6: See how much more elegant and visual the logic of the 5 Whys becomes when done via fault tree analysis?
In the fault tree example above, you can see where differential causal factors require differential thinking. At the bottom, you are getting closer to root causes. You may need to dig even deeper that this simple example. But if you look at the last causal factor in the middle branch (“… deemed ‘too expensive’ …”), you should realize a true fix to this issue may indeed be too expensive to implement. But your organization needs to do a formal ROI assessment to see if the cost to prevent future recurrence is greater than the cost of incurring perhaps dozens of repeat deviations for the same issue over the life of the production site. There’s not always a “right” answer, but there is an answer the business decides to do.
Time Series Plot (And/Or Control Chart)
If you don’t have control charts in place showing the continuous performance of critical steps, you either a) like to gamble or b) don’t have any critical processes.
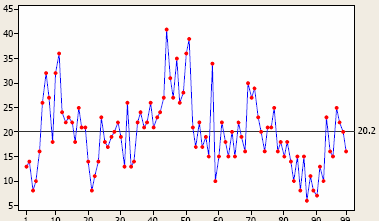
Figure 7: Time series plot measuring natural variation in something, with an average over time of 20.2 (right side)
Time series plots are designed to monitor performance outcomes over time. (They are also called fever charts because they were used most frequently for plotting fever trends.) Figures 9 and 10 below are examples. When you have a few instances of peaks, or conversely a spate of troughs, my advice is not to take any action unless you have a special, assignable cause that’s been hypothesis-tested for causality. And deciding what “peaks” and “troughs” are real versus process “noise” is where the control chart comes into play. Processes have noise, and this noise is the “common cause variation” you’ll always find in a chaotic universe.
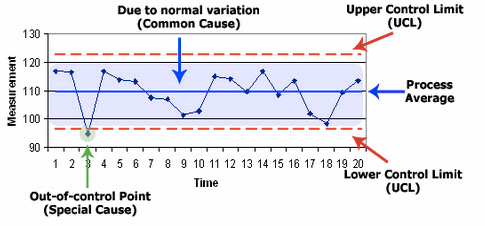
Figure 8: Example of Shewhart control chart and its major components
If you are able to detect “special cause variation,” this is where you would focus to try to understand root causes. If the entire sequence of data (the whole line plot itself) is too high or too low for what your business needs it to be, this is where you must sort out the voice of the customer (VoC), the voice of the business (VoB), and the voice of the process (VoP). To get all future sequence of data points to perform systematically and directionally different means you need to redesign the systems and processes so the output shifts in the desired way.
Systemic problems don’t go away by hope, a mindset invoked by many companies. In the same way, if your function has many problems you see or hear about on a consistent basis, putting together a monitoring trend chart doesn’t actually solve anything. It can help you recognize issues that weren’t visual before.
If you’ve been in a meeting where a group’s performance was chastised (“We need to improve the way we do x, y, and z”) and then there’s a period of time where performance improves (defects/errors reduce), that’s not sustainable. Nobody should take credit for that blip in performance if there was no formal countermeasure plan in place that the group collectively worked on. Only the Hawthorne Effect can take credit for short-term gains in that case**. Check out how this typically works in practice:
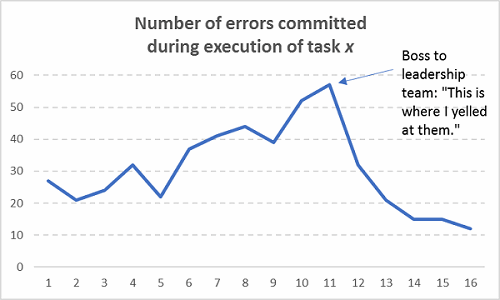
Figure 9: Assuming sustainable improvements occurred without actually fixing any processes (Hint: They’re not sustainable!)
And then what typically happens after the next six months:
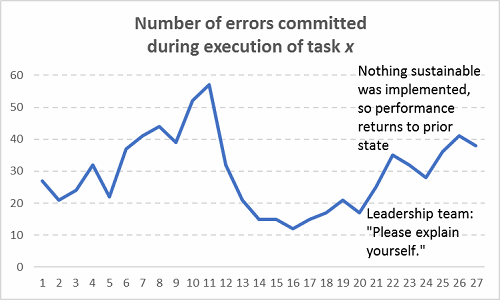
Figure 10: The return of stochasticity
Now, I’m not sure if you finished this article in the forecasted time of 6 to 8 minutes, but if you didn’t, no one is going to blame you because it wasn’t due to human error. Here is the data from the 12 test readers reviewing the article prior to publication from which that measure was derived:
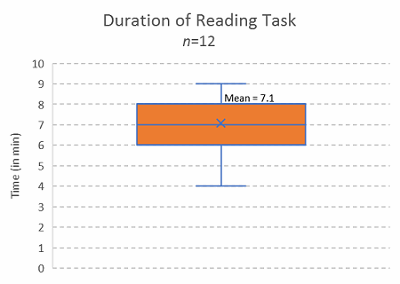
Figure 11: Reading duration of article, open focus test read
Stop blaming people for bad systems and processes. The people are the human capital that is actually doing the thinking and processing to generate profits for your company — unless there is data to suggest willful negligence or gross incompetence, then in that case address the talent development gap or termination. A nicely documented retraining of Alice or Bob isn’t going to improve successive outcomes on future iterations of the same work. Guaranteed. And I have plenty of data showing these sorts of human error interventions [retraining] are less than 5 percent effective at preventing recurrence of the problem.
Addenda:
* As an estimate, “about half” is the best we can all say. The lack of data across all organizations limits our ability to assess more precise estimates. Though, these numbers are similar in other industries, so it’s pointing to prevalent biases in reporting.
** The Hawthorne Effect is a renowned organizational performance psychological study which took place between 1924 and 1932. The main conclusion was that workers tended to improve their performance for a short time when they were observed. Performance would homeostatically decay back to prior levels after a short time. This is what happens during team admonishment sessions where everyone looks at a metric and hears “We need to do better at this.”
About The Author:
 Ben Locwin, Ph.D., has held executive roles for Top 10 pharma companies and has developed human performance models for organizations in startup biotech, hospitals and clinical care centers, aerospace, and the energy industry. He is an advisory board member for the Association for Talent Development’s (ATD) Healthcare Community of Practice and gives speeches to international audiences on improving business performance and patient outcomes. Get in touch with him at ben.locwin@healthcarescienceadvisors.com or via LinkedIn.
He has been featured in Forbes, The Wall Street Journal, The Associated Press, USA Today, and other top media. Remember — we are all (or will be) patients and recipients of these very same processes, so let’s make them better.