
Justification & Qualification Of Visual Inspection For Cleaning Validation In A Low-Risk, Multiproduct Facility
By Andrew Walsh, Dongni (Nina) Liu, and Mohammad Ovais
 Part of the Cleaning Validation For The 21st Century series
Proposals for the use of visual inspection (VI) as an analytical method for cleaning validation have been rising for several years now.1 This article discusses regulatory views on the use of VI as a sole criterion in cleaning validation, presents a case study on how inspectors can be qualified for VI, recommends the use of statistical techniques, and suggests how VI could be implemented as part of a control strategy in a cleaning validation program based on the level of risk.
Current Regulatory Views
In its 2015 update to Annex 15, the European Medicines Agency (EMA) indicated the possibility of using visual inspection alone in cleaning validation where it stated:
"A visual check for cleanliness is an important part of the acceptance criteria for cleaning validation. It is not generally acceptable for this criterion alone to be used."2 (emphasis added)
Implied in the wording of this guidance is that VI may be acceptable under certain conditions, as the original wording in the 2014 draft stated, “It is not acceptable for this criterion alone to be used.” (emphasis added)
Based on industry interest, and considering this wording change, the possibility of using VI as a sole acceptance criterion was included in the newly released American Society for Testing and Materials (ASTM) E3106 "Standard Guide for Cleaning Process Development and Validation" under the following conditions:
"Using visual inspection alone for validation may be acceptable only when the risk is low and 100 percent of the equipment surface can be inspected under appropriate viewing conditions.”3
This wording was selected to acknowledge that VI may be acceptable within these two criteria. However, E3106 does not provide guidance for determining when a risk is low enough or whether VI might still be used when somewhat less than 100 percent of equipment surfaces can be inspected by VI (e.g., 95 percent). This standard was meant to provide the first defined criteria that could be acceptable to regulators. (Note: Two of this article’s authors as well as several peer reviewers were co-authors of the E3106 standard.)
On April 16, 2018, the EMA posted an update to its Q&A on the Guideline for Setting Health Based Exposure Limits (HBELs).4 In this Q&A, there are two new Q&As (#7 and #8) that are directly applicable to the use of VI. These Q&As state:
Q7. Is analytical testing required at product changeover, on equipment in shared facilities, following completion of cleaning validation?
A: Analytical testing is expected at each changeover unless justified otherwise via a robust, documented quality risk management (QRM) process. The QRM process should consider, at a minimum, each of the following:
• the repeatability of the cleaning process (manual cleaning is generally less repeatable than automated cleaning);
• the hazard posed by the product;
• whether visual inspection can be relied upon to determine the cleanliness of the equipment at the residue limit justified by the HBEL.
Q8. What are the requirements for conducting visual inspection as per Q&A 7? <
A. When applying visual inspection to determine cleanliness of equipment, manufacturers should establish the threshold at which the product is readily visible as a residue. This should also take into account the ability to visually inspect the equipment, for example, under the lighting conditions and distances observed in the field.
Visual inspection should include all product contact surfaces where contamination may be held, including those that require dismantling of equipment to gain access for inspection and/or by use of tools (for example mirror, light source, boroscope) to access areas not otherwise visible. Non-product contact surfaces that may retain product that could be dislodged or transferred into future batches should be included in the visual inspection.
Written instructions specifying all areas requiring visual inspection should be in place and records should clearly confirm that all inspections are completed.
Operators performing visual inspection require specific training in the process including periodic eye sight testing. Their competency should be proven through a practical assessment.
From these Q&As, there is now sufficient regulatory guidance for industry to begin determining acceptable approaches to implementing VI as a control strategy in cleaning validation programs. This article proposes a systematic and comprehensive approach to address these points that are:
- Science-based
- Risk-based and
- Statistics-based
We believe these are minimum requirements for successfully implementing such programs. The following case study will illustrate how these three aspects were combined using the concepts in ASTM E3106 to implement successful usage of VI at the facility as a sole acceptance criterion for cleaning validation.
Case Study
A pharmaceutical facility was instituting a new cleaning validation program in response to a 483 observation. A risk assessment and cleaning validation studies were performed following the concepts in ASTM E3106.3 In accordance with ASTM E3106 and ICH Q9, this approach included the following four quality risk management (QRM) steps:
- Hazard (risk) identification
- Risk analysis
- Risk evaluation
- Risk control
Hazard (Risk) Identification
All raw materials used for manufacturing the 107 products at the facility were reviewed to determine the level of risk posed by any of these substances to patient safety. The cleaning agent components were also reviewed, as residues of the cleaning agent may have safety implications for patients as well. Over 350 excipients, 10 active pharmaceutical ingredients, and three cleaning agent components were included in this review. Only four of the active pharmaceutical ingredients were identified as posing a potential hazard to patient safety, so acceptable daily exposure (ADE) values were determined for them by a qualified toxicologist/pharmacologist (Table 1).
Table 1: List of APIs and their ADEs
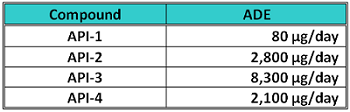
The other six APIs already had existing safety assessments documenting satisfactory safety profiles at product use levels. All of the cleaning agent components were on the FDA’s Select Committee on GRAS [generally recognized as safe] Substances (SCOGS) Database.5 Therefore, these compounds were considered safe and cleaning validation studies for them were deemed unnecessary based on the level of risk.
Risk Analysis
The risk analysis included selection of analytical methods, calculation of maximum safe carryovers (MSRs), calculation of maximum safe surface residues (MSSRs), and calculation of analytical swab limits from the MSSRs. As these APIs contained organic carbon, total organic carbon (TOC) was chosen as the analytical method. Although TOC is becoming the method of choice for cleaning validation, it is not applicable to APIs with no organic carbon content.
Table 2 shows the lowest possible TOC swab limits calculated for all the tanks in the manufacturing area. The manufacturing tanks have the largest surface areas in the facility and, since limits are inversely proportional to the equipment surface area, only the limits in the manufacturing area were calculated. All TOC swab limits for the other areas (e.g., packaging) would be substantially higher.
Table 2: MSSRs and TOC Swab Limits for All Tanks for All ADEs
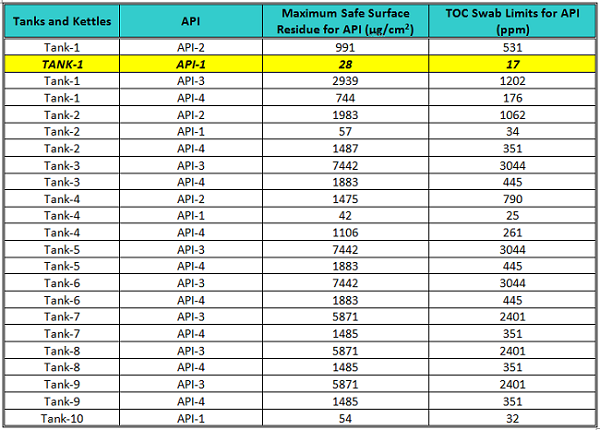
The lowest possible TOC swab limit was for Tank-1 (largest surface area) for API-1 (lowest ADE). So the TOC swab limit for API-1 in Tank-1 was chosen for setting the acceptance limits for this study.
TOC data was then collected for the cleaning procedures for five kettles, two packaging lines, and the raw material preparation area. The statistical analysis of these data showed these cleaning procedures are controlled well below the TOC swab limit for API-1 in Tank-1 of 17,000 ppb (17 ppm). The control chart in Figure 1 shows the data for these cleanings compared to the API-1 in Tank-1 (17 ppm). The upper control limit (UCL) for all of the TOC swab data was only 487 ppb, meaning that 99.87 percent of all the TOC swab data fell below this value.
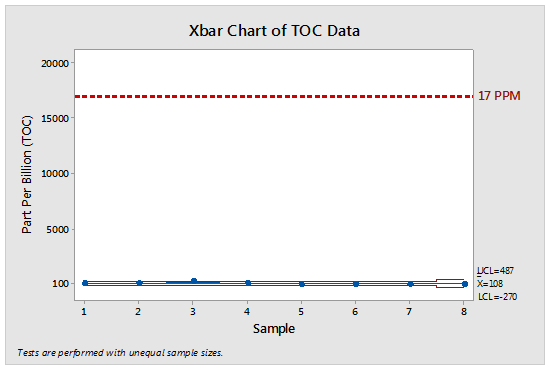
Figure 1: Control chart for all TOC results
Note: The data for runs #6-8 (packaging lines and raw material preparation area samples) use the Tank-1 limits in this chart, but it should be realized that their actual TOC swab limits would have been much higher than 17 ppm. These data should clearly satisfy the first criterion listed by EMA in its Q&A #7.4
Cleaning Risk Dashboard
Figure 2 presents a “cleaning risk dashboard” showing the level of relative risk for the cleaning processes at this facility based on three main risk factors associated with cleaning. These risk factors are:
- The Toxicity Score of API 1,
- The Process Capability Score for API 1,
- The Detectability Score of API 1 for VI.
It should be noted that all of these scores were derived directly from actual objective data.
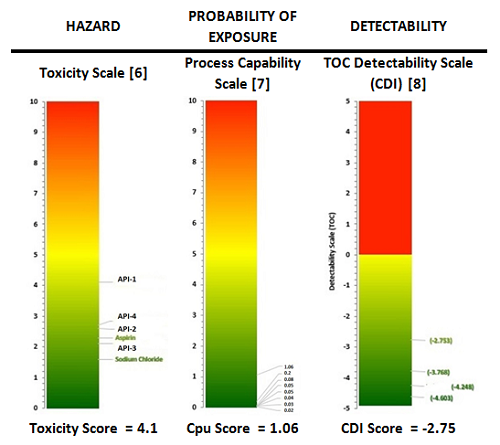
Figure 2: Cleaning risk dashboard for facility
The results of the risk assessment and the cleaning validation studies demonstrated that the products and cleaning procedures presented a very low risk to patient safety from cross contamination due to product carryover after cleaning. This analysis should clearly satisfy the second criterion listed by EMA in Q&A #7. These points above, combined with the ICH Q99 principle that the amount of validation effort, the formality, and the level of documentation should be commensurate with the level of risk, made this facility a strong candidate for converting to VI only.
Visual Inspection Qualification Case Study
Based on this risk assessment and supported by cleaning validation studies, the manufacturing site decided to institute a VI program. A qualification study that included 33 personnel from four different departments was developed and performed.
Materials and Methods
Materials
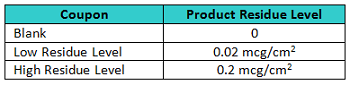
A total of 30 316L/#4 finish stainless-steel coupons were prepared for the qualification study by "spiking" three different levels of API 1 on to them as shown in Table 3. These coupons were individually numbered from 53 to 82 and randomly assigned to one of the three groups to help prevent inspectors from remembering coupons.
Table 3: Coupon Data
Methods
A list of all manufacturing personnel who were to participate in the qualification study was provided to the Center for Pharmaceutical Cleaning Innovation (CPCI). From the list provided, CPCI created a Measurement Systems Analysis for Attribute Data using Minitab 18 and generated data sheets for each inspector. This attribute analysis study was set up for three inspections for each of the inspectors.
Prior to the qualification study, a survey of light levels (in lux) in the manufacturing areas was taken using an Omega HHLM1337 Digital Illuminance Meter, and these results are shown in Table 4.
Table 4: Survey of Light Levels in Facility (lux)
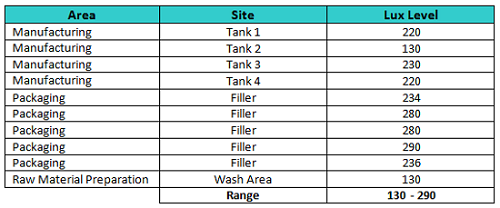
The coupons were randomly arranged along the edge of a large table in a manufacturing area and the light levels around the edge of the table were recorded (Figure 3) and were equivalent to those found in the other manufacturing areas (Table 4).
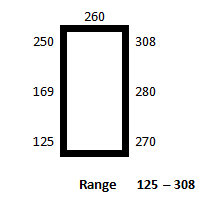
Figure 3: Light levels at coupon evaluation area (lux)
All personnel were provided no additional instructions other than to inspect the coupons for product residue as they normally inspect equipment after cleaning and to designate the coupons as either "Dirty" or "Clean" on data sheets provided. Theoretically, the inspectors should identify the blank coupons as clean and the low residue level and high residue level coupons as dirty. All personnel performed these inspections three times over the course of three days, with the exception of two individuals who had been absent and performed them over two days, with two of the inspections on one day (one in the morning and one in the afternoon). Before each inspection, the coupons were rearranged to prevent the inspectors from remembering the coupons.
In addition to the inspection data, metadata was also collected about the inspectors to examine whether these factors played any role in the results of the study. The metadata collected included the department of the inspector, inspector age, inspector years of service, inspector gender, and whether the inspector wore glasses or not.
Risk Evaluation (Evaluation of Results Against Acceptance Criteria)
The completed data sheets, including the metadata, were sent to the CPCI laboratory in Hillsborough, NJ for analysis. The acceptance criterion for the VRL was the level at which all inspectors could identify the dirty coupons correctly 100 percent of the time. All inspectors were able to correctly identify all of the dirty coupons at the 0.2 mcg/cm2 level 100 percent of the time but could not do so at the 0.02 mcg/cm2 level (approximately 90 percent did so).
A data analyst at CPCI analyzed and graphed the data using Minitab 18, R and SAS statistical software. The collected attribute data (Dirty/Clean) was analyzed using Minitab™ 18. Minitab 18 can analyze up to 10 inspectors for attribute analysis at a time. However, each department contained 10 personnel or fewer, so the inspection data was evaluated by department. Figures 4 through 6 show three graphs generated by Minitab that give extensive information on the analyzed data.
- Summary Report - This graph is an overall summary of the results including the overall misclassification rates and the overall percentage accuracy of each inspector. The first graph in the report shows the overall percentage accuracy on a scale that rates the acceptability of the results ①. The misclassification rates show the rates that the clean coupons were rated dirty and the dirty coupons were rated clean. In this case, none of the dirty coupons were rated clean, ② while 19.5 percent of the clean coupons were rated dirty. This can be considered acceptable, since clean equipment that is suspected of being dirty will simply be cleaned again. The percentage accuracy by appraiser is also shown, and the differences among the appraisers can be seen in this graph. One appraiser was accurate 100 percent of the time, ③ while another appraiser was accurate only 76.7 percent of the time, indicating a possible need for training ④.
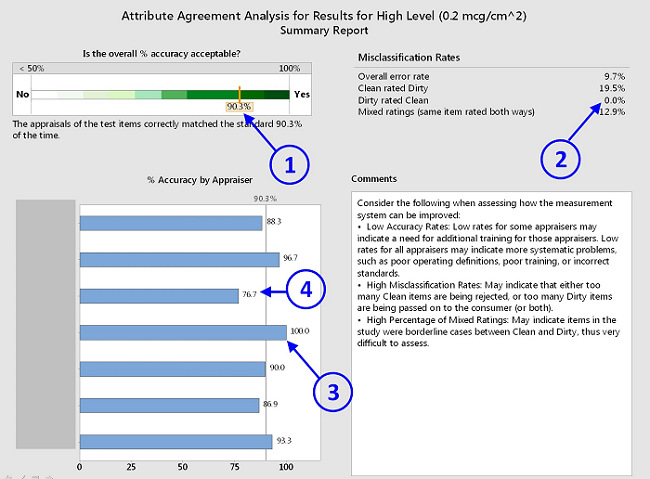
Figure 4: Attribute agreement summary report
- Accuracy Report - This graph shows the percentage accuracy for each inspector by appraiser, by standard, by trial, and by appraiser and standard collectively. Percentage accuracy by appraiser shows that three appraisers are significantly lower in accuracy than the others ①. The percentage accuracy by standard type (dirty or clean) indicates how well the two types of standards were identified. Here we see that the dirty coupons were all identified correctly, while the clean coupons were correctly identified >80 percent of the time ②. The percentage accuracy by trial shows whether there was any decrease over time. It can be seen that the accuracy seemed to decrease slightly as the qualification process went on ③. However, the results for all three trials are within the 95 percent confidence intervals, so the trials can be seen as equivalent at this confidence level. The final graph on the right shows the percentage accuracy of each inspector for both standard types. This is important for this study as it indicates whether all inspectors can correctly identify a dirty coupon at that level. For this group, all appraisers correctly identified the dirty coupons 100 percent of the time and two appraisers correctly identified the clean coupons 100 percent of the time ④. One appraiser incorrectly identified the clean coupons as dirty about half of the time, indicating that this person may require additional training.
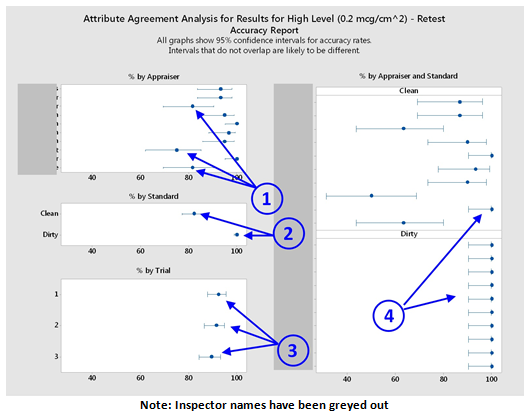
Figure 5: Attribute agreement accuracy report
- Misclassification Report - This graph provides details on the misclassification rates for both the coupons and the inspectors. For the coupons, the percentage of dirty rated clean was 0 ①. For the percentage clean rated dirty, the graph reveals that two of the coupons (#066 and #055) were misclassified at a very high rate ②. These coupons were examined to determine why they had such high misclassification rates. Coupon #066 was found to have a slight discoloration on its surface that was not noticed while preparing the coupons, which many inspectors mistakenly identified as residue. Coupon #055 was found to have a spot on its surface that was not present at the time of preparation and must have occurred during the qualification. This report not only helps explain the rate of misclassifying the clean coupons as dirty but also points to the need for increased scrutiny of the clean coupons prior to the qualification process and careful monitoring of the coupons during the qualification to prevent errors from occurring. The graphs in the appraiser misclassification rates provide insight into the inspectors. For example, for this group we see that one inspector correctly identified all clean coupons, while another inspector misclassified the clean coupons as dirty over 40 percent of the time ③.
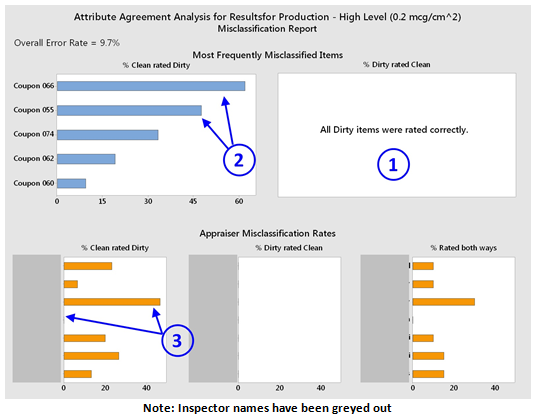
Figure 6: Attribute agreement misclassification report
Risk Evaluation (Detectability Of Cleaning Process Failure)
Table 1 showed the MSSRs calculated for all the tanks in the manufacturing area. The tanks have the largest surface areas in the facility and, since limits are inversely proportional to the equipment surface area, only the limits in the manufacturing area were calculated. As with the TOC swab limits, all the MSSRs for the other areas would be much higher. The lowest possible MSSR was for Tank-1 (largest surface area) for API-1 (lowest ADE). Therefore, API-1 was chosen for this evaluation.
At the 0.2 μg/cm2 level for API-1, all inspectors correctly identified all of the dirty coupons, while at the 0.02 μg/cm2 level for API-1, inspectors correctly identified all of the dirty coupons only 90 percent of the time. Therefore, the 0.2 μg/cm2 level for API-1 level was selected to be the VRL for API-1. A scale for evaluating detectability based on the VRL has been described in a previous article10 and was used to calculate a detectability score, or visual detection index (VDI), based on a VRL of 0.2 μg/cm2 for API-1 that was determined in this study.
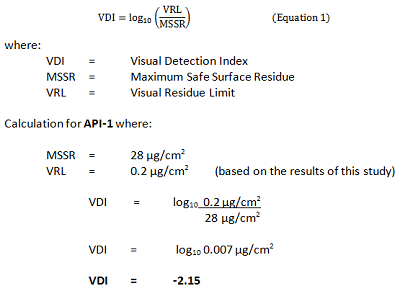
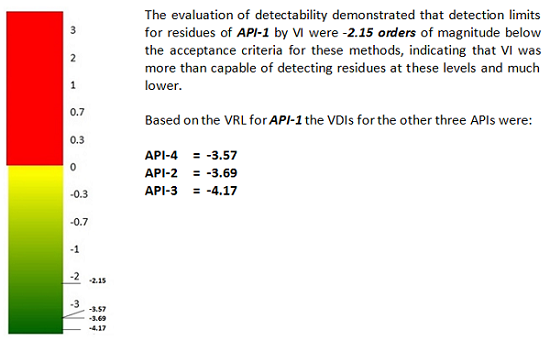
Figure 7: Detectability score for API-1
The VDI can be used in conjunction with the ADE-derived toxicity scale6 and the Cpu-derived probability scale7 as tools to evaluate the level of risk in cleaning validation. Going further, the toxicity scale could also help define the circumstances for VI (low hazard) and the detectability scale can provide the justification (easy to see at levels well below the MSSR for that hazard).
For analysis of the metadata collected during the study (department, age, years of service, gender, and use of glasses), click here.
Discussion of Results
The qualification study for performing VI for the manufacturing equipment demonstrated that all personnel can identify the presence of API 1 residues on manufacturing equipment surfaces at a level of 0.2 µg/cm2 correctly 100 percent of the time.
- This 0.2 µg/cm2 level is more than 100 times lower than the lowest ADE-based residue limit of 28 µg/cm2 for API 1 in Tank-1. Considering that all other API limits are more than 10 to more than 1,000 higher than API 1, these compounds would also be clearly visible at these levels. Since all the visible residue limits are much higher for all other equipment, this qualification is considered to apply to these products as well.
- The evaluation of detectability also demonstrated that detection limits for residues by TOC and VI were 2.75 and 2.15 orders of magnitude, respectively, below the acceptance criteria for these methods, indicating both of these methods were more than capable of detecting residues at these levels.
- No noticeable differences were found with VI regarding the department, age, years of service, or the gender of the personnel or whether they wore glasses or not and these are not factors that affect VI.
The results of this qualification study, including the analysis of the metadata, should satisfy the third criterion listed by EMA in its Q&A #7.
Therefore, it was recommended that this facility could move from TOC swab testing to VI for future studies and to qualify all operators and inspectors on VI. Unless a new product is introduced with a lower ADE than API-1, VI will be considered acceptable as the sole criterion for the cleaning validation acceptance limit for all products, current and future, manufactured at this facility.
Implementing Visual Inspection As Part Of A Cleaning Control Strategy
Based on the data collected, their analysis, and the experiences in this case study, the following observations and recommendations on implementing VI programs can be made.
Coupons
During this study, a number of observations were made about the coupons used. As also noted in the previous article,1 coupons can be easily damaged or contaminated and this could affect the results of the study, so storage, handling, and maintenance of coupons are important. Coupons for this study were kept in a storage box and each coupon had "feet" added to each corner of the underside of the coupon to facilitate handling. All the coupons were labeled as to the material of construction (316L SS/#4 Finish), with the date (month/year) of manufacture, and individually numbered. (Figure 8).
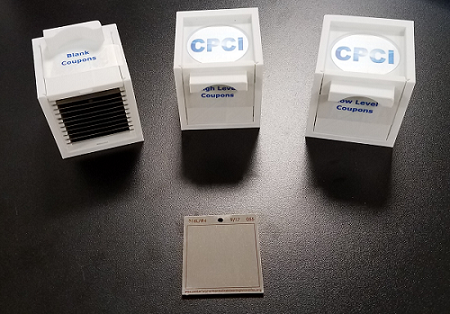
Figure 8: Coupons and storage boxes
Coupon Preparation
For VI qualification studies to be valid, the coupons must be prepared in a manner that leaves a residue on the coupon that is the same in appearance as will be encountered in the manufacturing area. Evaporative drying has been studied for many solvents, including water, and there are significant differences in the deposition patterns of residues depending on the solvent.11 Consequently, the improper preparation of coupons may lead to erroneous conclusions. Some workers have been using solvents (e.g., methanol) to deposit the compounds and drying them under conditions not encountered in operations (e.g., under a nitrogen stream). Such techniques are not recommended. The coupons for this study were spiked and dried in a manner that simulated the actual conditions in the facility's manufacturing area. API-1 was dissolved in purified water, spiked onto the coupons and then dried in an oven at 90°C. This procedure simulated the actual conditions in operations, that is, a hot purified water rinse with hot equipment surfaces for the API-1 residue to dry quickly on. After preparation, all coupons should be examined to ensure they have been prepared correctly, including verifying that the blank coupons do not have stains, scratches, or fingerprints that may mislead the inspectors and confound the qualification study as has been pointed out above. Also, for one product to represent other products in a VI study, the residues of the other products must be similar in appearance (e.g., a white residue may not be similar to a blue residue).
Inspector Training
Most inspectors throughout the industry have been inspecting and releasing manufacturing equipment for many years and most know through experience what product residues look like and can accurately identify them. However, some may have not seen, or have not been formally shown, product residues so they may not truly be sure what product residue looks like. This study revealed that a few inspectors can miss product residues that should be seen, and some misidentified a discoloration on a clean coupon as product residue. In this study, no training was provided deliberately to see how well the inspectors would do without training. While the majority did not require specific training, it was clear that training of inspectors prior to the study on what to look for is both beneficial and necessary. However, this training should be provided as a means to identify product residues on manufacturing surfaces and not as a means to identify product residues on coupons. Therefore, inspectors are best trained using residues on actual manufacturing equipment and not with coupons. The same training for identifying product residues on manufacturing surfaces should be sufficient for inspectors to accurately identify product residues on coupons. This would further help legitimize the results of a VI qualification study. While SOP training is necessary and required, it must go beyond training the inspectors to look at equipment and fill out inspection forms.
Viewing (Lighting) Conditions
Light levels are typically suspected by most industry workers to be critical parameters, but experiments and experience has not held this to be true. Some studies have been performed showing no differences in inspection when light levels are between 200 and 1,400 lux.12 This should not be considered unusual. The human eye is capable of rapid adaptation to changing light levels over a very wide range of intensities and the eye adapts to minor differences in light levels almost instantaneously and unnoticeably.13 Therefore, minor changes in light levels, or minor changes in distance or the angle of viewing during inspection, may have little impact on the ability to inspect successfully. As mentioned, the human eye is very compensating; regardless, workers performing VIs should still be trained to correctly identify product residues and ensure that an appropriate inspection is performed.14
Documentation Review
A means of documenting VI on a continuous basis for routine monitoring should also be implemented. The documentation level for VI should be commensurate with the level of risk and the complexity of the equipment being inspected. In addition, documentation should be reviewed for trends and anomalies as a part of knowledge management program.
Attribute Analysis
The use of attribute analysis for statistically analyzing the data collected in this study greatly increased the amount of information about the inspection, while being relatively easy and simple to perform. Since there were only two levels used in the study (0.2 and 0.02 µg/cm2), with the 0.2 level achieving 100 percent accuracy and the 0.02 only achieving 90 percent accuracy, the designation of the VRL was set to 0.2 µg/cm2. However, it may well be the case that the accuracy could be 100 percent at the 0.15 µg/cm2 or even at the 0.1 µg/cm2 level. Logistic regression is a powerful statistical analysis that could be used to determine the VRL exactly by using several levels.15 A subsequent study is planned to explore the use of logistic regression while still being designed to be simple and easy to implement.
VI Qualification Programs
Most cleaning validation workers are well aware of the time and resources involved in developing and validating swab methods, the sampling of equipment, analyzing the samples, and releasing the equipment for use. While the idea of using VI only may seem simple and very attractive, the process of qualifying a large group of inspectors for VI should not consume an equal or greater amount of time and resources. For VI to become desirable, valuable, and accepted, the qualification of VI must also be an easy program to implement, document, and maintain (requalification), accepted by regulators, and ultimately valid.
The approach described in this article was relatively simple to set up, execute, and analyze. The coupons were prepared in less than one day. The set up and collection of data took only three days and only a total of about 15 minutes of each inspector's time (three inspections x five minutes each). The statistical analysis of the data took approximately three days by one analyst. This is a reasonable amount of effort and time that yielded a great deal of process knowledge and understanding.
We believe that, going forward, the products selected for VI must be low hazard products based on their HBELs (science-based), should have demonstrated reliable cleaning processes that do not present any significant concerns for patient safety (risk-based), the VI data collected must be analyzed appropriately to demonstrate that the VI is valid (statistics-based), and the VRL should be shown to be well enough below the MSSR to be legitimate to use. As shown above, statistical analysis of VI data is very revealing and can identify issues with inspectors and problems with coupons and provides significant insight into the inspection process, so it should not be considered optional.
Summary
As stated in the introduction, we believe that this study met all the criteria provided by the EMA's Annex 15 Guideline and the new Q&As #7 and #8. The authors hope that the study described in this article will satisfy regulatory concerns, increase the science, risk analysis, and use of statistics behind qualifying VI, and help other companies to implement VI on science-based and risk-based foundations.
Peer Review
The authors wish to thank our peer reviewers Bharat Agrawal; Thomas Altmann; James Bergum, Ph.D.; Alfredo Canhoto, Ph.D.; Gabriela Cruz, Ph.D.; Mallory DeGennaro; Parth Desai; Kenneth Farrugia; Ioanna-Maria Gerostathi; Igor Gorsky; Miquel Romero Obon; Laurence O'Leary; and Osamu Shirokizawa for reviewing this article and for their insightful comments and helpful suggestions.
References
- Desai, Parth and Andrew Walsh, "Validation Of Visual Inspection as an Analytical Method For Cleaning Validation", Pharmaceutical Online, September 2017
- EudraLex, Volume 4 – Guidelines for Good Manufacturing Practices for Medicinal Products for Human and Veterinary Use, Annex 15: Qualification and Validation, available from: https://ec.europa.eu/health/documents/eudralex/vol-4_en.
- American Society for Testing and Materials (ASTM) E3106-17 "Standard Guide for Science and Risk-Based Cleaning Process Development and Validation"
- Questions and answers on implementation of risk-based prevention of cross-contamination in production and ‘Guideline on setting health-based exposure limits for use in risk identification in the manufacture of different medicinal products in shared facilities’ (EMA/CHMP/CVMP/SWP/169430/2012)
- Food and Drug Administration Generally Recognized As Safe compounds data base https://www.fda.gov/Food/IngredientsPackagingLabeling/GRAS/SCOGS/default.htm
- Walsh, Andrew, Ester Lovsin Barle, Michel Crevoisier, David G. Dolan, Andreas Flueckiger, Mohammad Ovais, Osamu Shirokizawa, and Kelly Waldron, "An ADE-Derived Scale For Assessing Product Cross-Contamination Risk In Shared Facilities", Pharmaceutical Online, May 2017
- Walsh, Andrew, Ester Lovsin Barle, David G. Dolan, Andreas Flueckiger, Mohammad Ovais, Osamu Shirokizawa, and Kelly Waldron "A Process Capability-Derived Scale For Assessing Product Cross-Contamination Risk In Shared Facilities", Pharmaceutical Online, August 2017
- Walsh, Andrew, Thomas Altmann, Alfredo Canhoto, Ester Lovsin Barle, David G. Dolan, Andreas Flueckiger, M.D., Igor Gorsky, Robert Kowal, Mariann Neverovitch, Mohammad Ovais, Osamu Shirokizawa and Kelly Waldron. "A Swab Limit-Derived Scale For Assessing The Detectability Of Total Organic Carbon Analysis", Pharmaceutical Online, January 2018
- International Conference on Harmonisation of Technical Requirements for Registration of Pharmaceuticals for Human Use, ICH Harmonised Tripartite Guideline, Quality Risk Management – Q9, Step 4, November 2005, www.ich.org.
- Walsh, Andrew, Ester Lovsin Barle, David G. Dolan, Andreas Flueckiger, Mohammad Ovais, Osamu Shirokizawa, and Kelly Waldron "An MSSR-Derived Scale For Assessing the Detectability of Product Cross-Contamination Risk In Shared Facilities", Pharmaceutical Online, December 2017
- Xuefeng Xu and Jianbin Luo "Marangoni flow in an evaporating water droplet" American Institute of Physics, Applied Physics Letters 91, 124102, 2007
- Forsyth, R.J., and Hartman, J., “A Risk-based Approach to Cleaning Validation using Visible Residue Limits,” Pharmaceutical Engineering, May/June 2008, Vol. 28 No. 3, pp. 8-22, www.pharmaceuticalengineering.org.
- Levin, L.A., et al., Adlers’ Physiology of the Eye: Expert Consult, Elsevier Health Sciences, 11th Edition, 2011, www.us.elsevierhealth.com.
- Melchore, J.A., “Sound Practices for Consistent Human Visual Inspection,” AAPS PharmSciTech, March 2011, Vol. 12, No. 1, pp. 215-221, http://link.springer.com/journal/12249.
- Ovais, M., “Statistically Justifiable Visible Residue Limits,” Pharmaceutical Technology, March 2010, Vol. 34, Issue 3, pp. 58-71, www.pharmtech.com.