
Knowledge Management — Opportunities & Challenges For Legacy Drug Products
By Prakash Patel, Sigmapharm Laboratories, and Igor Gorsky, ValSource, Inc.
In a popular Web encyclopedia, knowledge management is defined as “the process of capturing, developing, sharing, and effectively using organizational knowledge. It refers to a multidisciplinary approach to achieving organizational objectives by making the best use of knowledge.”1 A continued process verification (CPV) program (stage 3 of process validation) for legacy products in an outsourced environment serves as a great example of where an effective and efficient knowledge management platform is essential to the success of the product.
This article will explore specific challenges of managing knowledge in a legacy manufacturing environment and propose viable, practical solutions that have been found to be effective. These solutions allow practitioners to increase product and process understanding as well as performance.
Data, Statistical Analyses Are Key To Understanding Process Performance
A typical CPV program needs to include solid governance based on statistical rules and methods. A procedure requiring formal CPV planning for legacy products is an essential part of successfully capturing product and process knowledge on a continuous basis. Although mere collection and evaluation of data may not solve all your possible issues, it enables you to identify and understand them better. The identification of true root causes of issues is a key to developing successful corrective and preventive action strategies.
An annual product quality review (APQR), as per 21 CFR Part 211.180(e), and CPV — requiring an ongoing monitoring of processes — may seem like activities that go hand in hand; however, they have different goals. While the APQR is a regulatory filing exercise, CPV is a tool for monitoring and improving the process. The plan outlining review frequency forces pharmaceutical manufacturers to generate reports at a specified interval, and the use of statistical tools helps in visualizing the current state of processes. The most important outcome of such reports is critical quality attribute (CQA) trending of incoming materials, in-process materials, and finished products. In several instances, the trends in CQA performance have correlated to their respective critical material attributes (CMAs) and critical process parameters (CPPs). Use of automated equipment and technology during the manufacturing process also generates a significant number of data points that can help the user understand the product and process performance. This product knowledge can be used to optimize the processes and ensure the product manufacturing remains in a “state of control.”
To implement a viable CPV plan for a legacy product, all in-process, analytical, and release data should be assembled. Audited transcription from scanned batch records and analytical laboratory results in a product-specific master data file in a qualified spreadsheet, or data can be directly transferred into a statistical software package. The evaluation of statistical analyses should be performed by trained statistics experts. A few examples of statistical evaluations that help understand the process performance are described below.
A data distribution is performed to assess both central properties and dispersion of the data. It provides both visual and statistical outputs for evaluation.
Statistical process control (SPC) charts are used to present individual or sub-grouped data collected from a process running over time. They may include control limits, which are the natural boundaries of a process.
Process capability/performance analyses are executed to present the statistical measure of the ability of a process to produce output within specification limits.
An analysis of variance (ANOVA) is used to determine the proportion of influence a factor or set of factors has on total variation. It subdivides the total variation of a data set into meaningful component parts associated with specific sources of variation, facilitating targeted improvement activities.
The CPV plan should include process flow diagrams/process maps for easy understanding of processes. A risk assessment for a legacy product is shown in Figure 1.

Figure 1: A risk assessment for an oral solid dose (OSD) legacy product (click for expanded view)
It should be noted that risk assessments for each product’s process should be evaluated on a periodic basis (typically no less than annually).
The CPV report should include a product technical dashboard.
Product Technical Dashboard
Knowledge management is considered one of the most important aspects in a mature pharmaceutical quality management system to achieve consistent manufacturing of legacy products. Therefore, effective data collection, review, analysis, evaluation, and communication are pivotal to problem-solving, risk management, and decision making. What to track and how to represent data and information in a succinct, easy-to-review fashion become critical. Therefore, technical teams have developed product technical dashboards, which depict a product’s and process’ current status and serve as references for review meeting discussions, as well as for presentations to the rest of the teams. An example of a product technical dashboard is illustrated in Figure 2. These dashboards list:
- Product CQAs with their respective specifications (including a pie chart for better visual representation);
- Current process capability indices for these CQAs and their directional movement since the last dashboard;
- Status of ongoing projects for the product; and
- Predicted failure rates for the product.
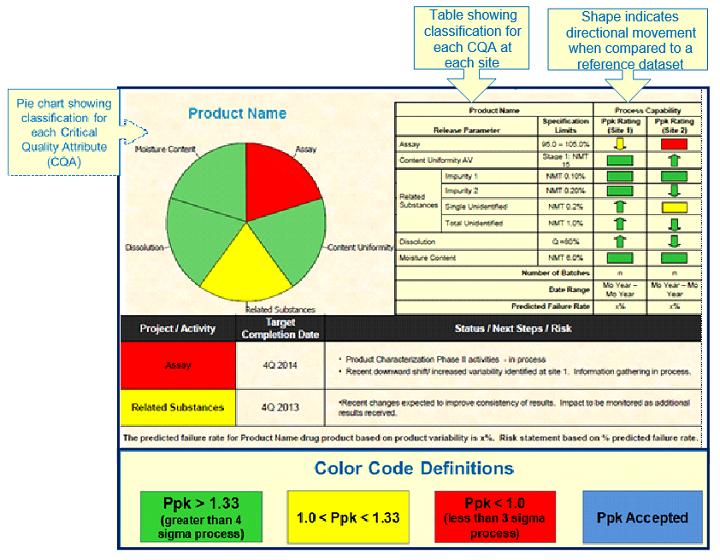
Figure 2: Example product technical dashboard
Knowledge Management Impact On Product And Process Understanding And Improvement
The management of data that are collected manually and electronically results in increased process and product understanding and improvement. Figure 3 below shows a process improvement life cycle that utilizes knowledge management at its core. The flow of data and information derived from these data is used to determine a product’s risks and initiate projects for risk mitigation or elimination. Technical teams determine risk to the process based on the data being monitored. Then, the projects are proposed and vetted through teams. Subsequently, improvements to processes are implemented and the continuous monitoring program confirms improvements in the process.
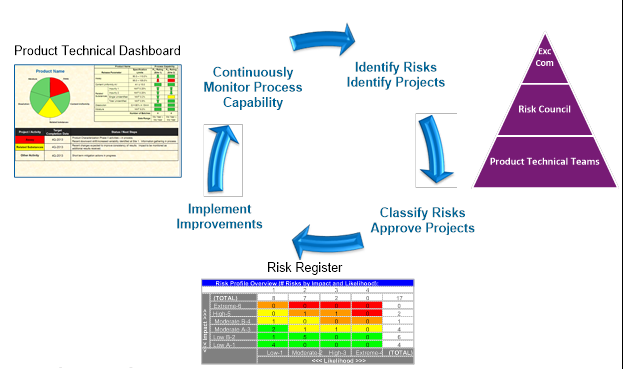
Figure 3: Process improvement life cycle
Similarly, Figure 4 illustrates a life cycle of improved process understanding. In this depiction, criticality analysis is performed for each CQA. Based on this analysis, the monitoring plans for each product are developed. Manufacturers collect data using manual transcription into Part 11 compliant data acquisition and analysis computerized solutions. Then, teams dedicated to specific legacy products jointly review the data and identify needed improvements, which are subsequently implemented. Monitoring of improvements in the process continues while new opportunities are being identified.
These product/process programs have been very successful for manufacturers. Figure 5 depicts an example of improved CQA process capability indices of a product over a period of just one year. It is obvious that dramatic improvements were achieved.
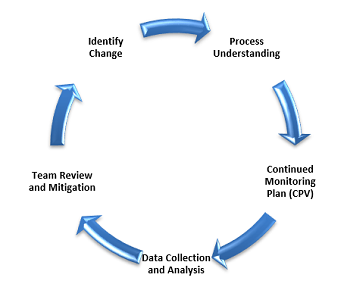
Figure 4: Increased process understanding life cycle
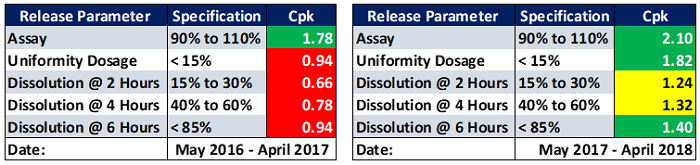
Figure 5: Example of product CQA process capability indices improvements over a period of one year.
Conclusion
Although product manufacturing teams have achieved tremendous improvements in product/process understanding and performance, they continue working on identifying and implementing new improvements. These teams work on identifying and mitigating of challenges that arise from: changes in business objectives and companies’ leadership, processes and priorities that are not always aligned, and ongoing globalization of supplier networks.
Effective and efficient joint knowledge management solutions help firms improve product understanding, process understanding, and material property understanding. The ongoing monitoring program can help companies formalize and capture the vast majority of tribal knowledge into structured documents.
To address these difficult tasks, innovative knowledge management technology solutions are being developed and implemented. These future solutions will include obtaining relevant data in real time, managing large volumes of data, and integrating data from diverse sources. Most importantly, an effective KM solution ensures patients receive high-quality products at the lowest cost.
References:
About The Authors:
 Prakash Patel is the vice president of the Quality Operations Division of Sigmapharm Laboratories, LLC, where he heads the company’s commercial manufacturing, quality assurance, and compliance functions. As the head of Quality Operations, he oversees the division’s Operations, Quality Assurance, and Compliance & Auditing departments. He has participated in, and managed, several successful FDA inspections of the company and other key projects. He has an MS in pharmaceutical manufacturing engineering from the Stevens Institute of Technology and a BS in pharmacy from the Rajiv Gandhi University of Health Sciences, Bengaluru, India.
 Igor Gorsky has been a pharmaceutical industry professional for over 30 years. He held multiple positions with increasing responsibility at Alpharma, Wyeth, and Shire. He worked in production, quality assurance, technical services, and validation, including as associate director of global pharmaceutical technology at Shire. He is currently principal consultant at ValSource. He is leading the PDA Water Interest Group and a PDA Task Force for revision of PDA TR 29: Points to Consider for Cleaning Validation. In addition, he is a member of ASTM E55 and one of the authors of ASTM E3106 and E3207. He has a BS in mechanical/electrical engineering technology from Rochester Institute of Technology.