
Minimizing The Impact Of Human Errors Using Relational Risk Analysis
By Mark F. Witcher, Ph.D., biopharma operations subject matter expert

People can make mistakes – you should plan on it. This article describes how a mechanism-based risk analysis approach can provide two complementary opportunities for minimizing the likelihood of a human error impacting pharmaceutical and medical device risks.
Minimizing the impact of human errors remains one of the industry’s most vexing and challenging objectives. This article describes how relational risk analysis (ReRA) can be used to model, understand, and minimize the likelihood of human errors causing harm to manufacturing operations including aseptic processing, product quality, procedure execution, activities, and any actions that could eventually harm patients.1,2,3,4
ReRA is the first of a new generation of mechanism-based risk analysis methods that focus on analyzing the mechanisms, processes, and systems that produce risk event outcomes such as preventing harm or achieving a beneficial objective.
The classical model for understanding and controlling human errors is Reason’s Swiss cheese model shown in Figure 1.5
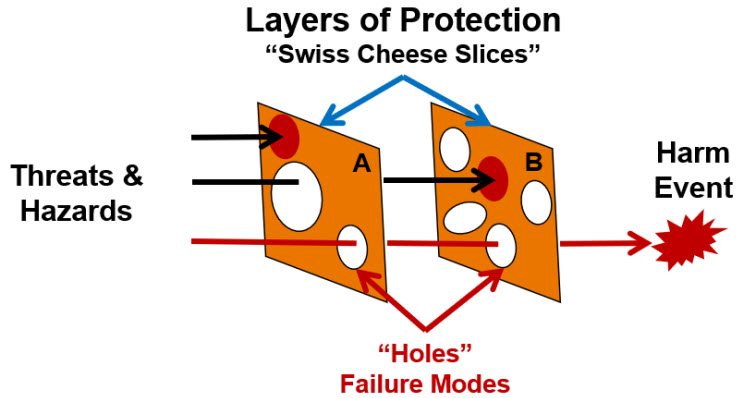
Figure 1: Reason’s simplistic Swiss cheese view of protective layers for preventing harm. The diagram shows two slices, A and B, blocking the flow of threats and hazards from causing harm. Some versions can contain many layers.5
The concept that harm can be prevented by placing protective barriers that block the flow of threats is both intuitive and appealing. The layers fail because they have holes that can be viewed as failure modes. While the concept of events flowing to a final outcome is useful, Reason’s model is incomplete because the layers are not well defined and do not provide an obvious method of estimating, managing, and communicating the probability of the harm occurring.
ReRA expands the “event flow” concept using the system risk structure (SRS) shown in Figure 2 to identify and define the layers of protection as risk mechanisms or systems that control the probability of threat events, in this case a human error, from resulting in a harm event from a subsequent important risk mechanism or system.
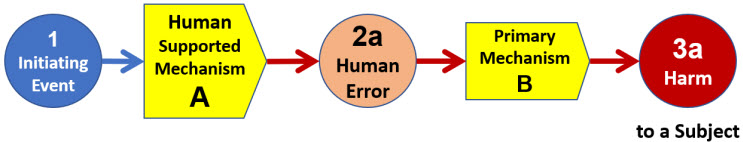
Figure 2: Basic SRS for describing the impact of a human error (2a) on an important primary risk mechanism (B) that could result in harm event (3a) to a subject. The risk is initiated by a triggering event (1) to a human activity containing a risk mechanism (A) for performing actions or activities required by a primary risk mechanism (B). By convention, events are numbered and the risk mechanisms lettered. The SRS structures the risk 1-A-2a-B-3a.
As described in the appendix, all ReRA risk systems, including A and B, are modeled to have two output events: failure (a) or success (b). Since the article addresses human failures and the resulting harm, the success events are not addressed directly. For a more complete description of ReRA’s handling of both success and failure, see the appendix and references.
The subject of the risk can be the quality of a product or medical device or the output of a process or manufacturing operation. The subject is harmed by a human failure passing through the primary mechanism, process, or system to the subject. If the subject is a patient, then system B must contain all the mechanisms that directly connect the human error to the patient harm, including the patient’s therapeutic and physiological responses and possible medical treatment required to protect the patient from serious harm.3
In the SRS shown in Figure 2, it is not assumed that success of system A will make system B successful. A more complete SRS that includes risk event 2b (system A’s success) and a more completely defined system B that includes other threats such as equipment failures and system B failure modes may be required to model the probability of success of system B to reach 3b (no harm or a beneficial outcome).
The SRS in Figure 2 is supported by a summary risk register (RR) in Table 1 describing the five elements of the SRS.
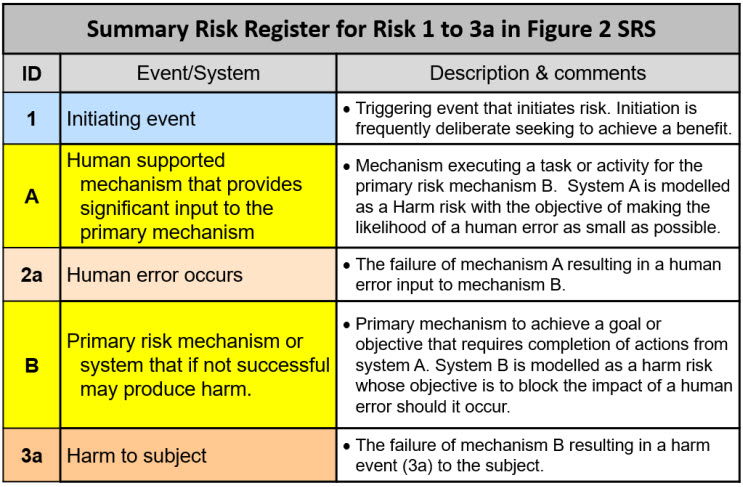
Table 1: Summary risk register for describing the SRS shown in Figure 2 of an initiating event (1) seeking to achieve a benefit that could result in harm to the subject.
Examples of system A can be a single written or verbal instruction or as complex as a long, detailed written analytical, manufacturing, maintenance, or operating procedure or method being executed by one or more human operators. Execution of system A might also include the use of instruments and equipment that could be modelled as part of system A.2
Examples of system B can include setting up and operating aseptic processes, running analytical tests, making media or buffers, operating a medical device, and countless other processes, instruments, devices, equipment, or systems that require an operator’s input. System B can be very simple or an extremely complex sequence of processes and systems.3
Since the severity of a harm to a subject is almost always obvious, the primary purpose of a risk analysis is to estimate the probability of a harm event occurring. If either a different impact severity or subject is defined, then the risk may have a different probability of occurrence. The risk analysis also provides a basis for managing the risk by modifying the mechanism should the probability of the outcome event’s occurrence be unacceptable given the outcome’s impact.
The Probability Of Harm Occurring
Using the basic SRS shown in Figure 2, the probability of harm to a subject occurring can be estimated using the expanded SRS shown in Figure 3.
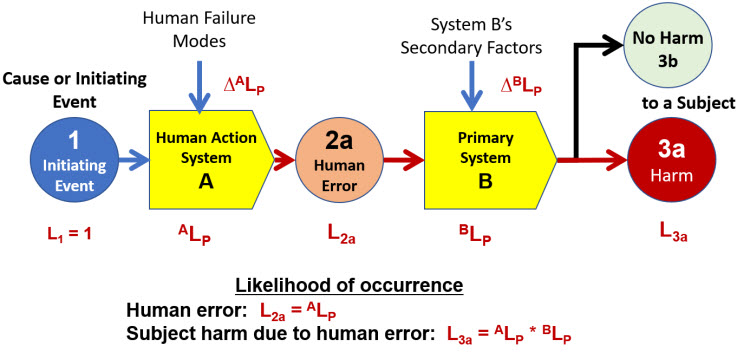
Figure 3: SRS for the risk of harm occurring to a subject as the result of a human error. The occurrence of a human error can be viewed as the “top event” of a bow-tie approach.6
The risk is deliberately initiated as a cause event requiring human actions (system A) to be performed as inputs to a primary mechanism (system B) that could result in a harm to the subject if a human error occurs. The SRS shows the probability terms for each event and system. The details of the elements are shown in the risk register template in Table 2.
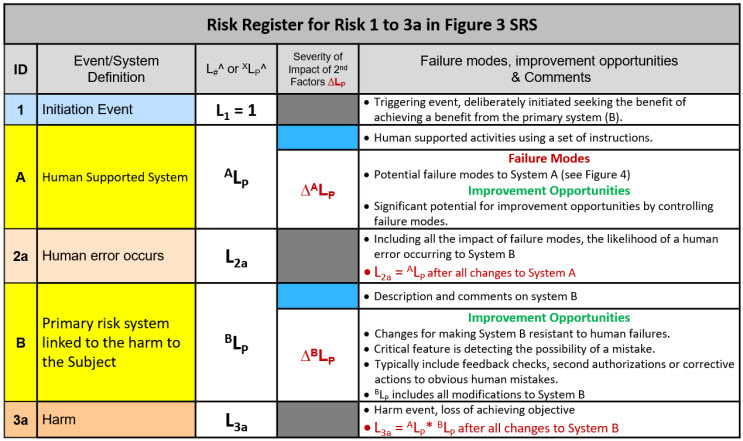
Table 2: Risk register (RR) template for the SRS shown in Figure 3. The RR can be used for documenting the analysis decisions and risk management actions taken to make the risk acceptable.
Table 2 provides a template for analyzing the specific risk associated with the primary system (B) failing due to a human error described by system A. The probability of each system failing is estimated by the analysis team based on their knowledge and experience of similar systems that could include historical data.
For at least an initial risk analysis, XLPs can be estimated to an order of magnitude as shown in the appendix. Similarly, the ∆XLPs of both failure modes (FMs) that might increase XLP or improvement opportunities (IOs) that could decrease XLP can similarly be estimated to an order of magnitude. If the FM or IO does not improve an XLP by at least one order of magnitude, it may not be worth further analysis for implementation.
The purpose of the analysis is only to make sure that the XLPs are low enough to be acceptable. If they are not acceptable, risk management identifies FMs that can be controlled and IOs that can be implemented to have the cumulative effect of making the XLPs acceptable. The risk SRS shown in Figure 3 and the register template shown in Table 2 can be used to document and communicate the analysis and rationales to decision makers and regulatory agencies.
Preventing Harm From A Human Error
The SRS shown in Figure 3 provides two relatively obvious opportunities for reducing the likelihood of human errors resulting in harm to a subject. The first opportunity is to reduce the likelihood of the human error occurring (ALP) by reducing the likelihood of failure modes (∆ALP) happening to the people in system A. Many of the failure modes that reduce human success are shown in Figure 4. The focus of building and maintaining system A is to establish a supportive environment designed to maximize the probability of the people being successful, i.e., a low ALP failure rate.
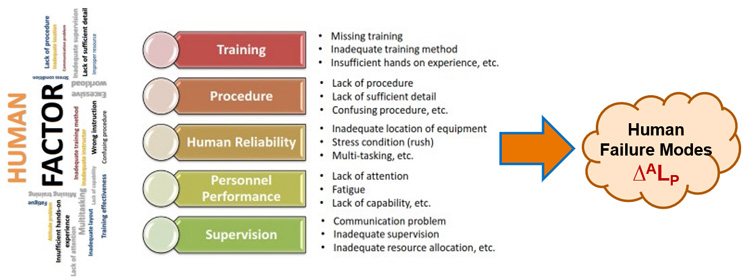
Figure 4: Sources of human failure modes ∆ALP. Figure adapted from Jinwoo Kim’s presentation, “Human Factor Control Strategy for Aseptic Manufacturing,” at PDA’s 3023 Aseptic Processing Conference.2
Human failures are prevented by building supportive environments in which they are expected to perform their activities, including making decisions. Proper training, practice at executing tasks, clear and complete procedures, screening for limited focus and attention spans, good supervision, etc., provide supportive system As. As an example, analysis of A might find the people are subject to disruptions, thus requiring limiting access to cell phones and controlling other distractions.
The second opportunity for preventing harm is for system B to be designed to prevent or block a human error resulting in harm to the subject. Many primary systems can be designed to detect possible errors and require confirmation of a possible incorrect instruction or take corrective actions. Good examples of preventive actions are cars that correct lane drifting of distracted or sleepy drivers or stop automatically to prevent collisions with slow or stationary objects. Another is the undo button in many computer programs that require confirmation when deleting files.
Summary
The purpose of a risk analysis is to analyze and, when necessary, manage risk mechanisms to make the probability of an outcome acceptable. If not controlled, human errors can frequently result in an unacceptable likelihood of harm to a subject. The mechanism-based ReRA approach can provide a straightforward method of identifying the risk mechanism that contains human activities (system A) so that a supportive mechanism can be constructed as an opportunity to minimize the possibility of human errors occurring. In addition, the primary risk mechanism (B) can be modified as a second opportunity to minimize or control the probability of a human error resulting in a final harmful outcome. When the severity of harm is especially severe, both risk mechanisms should be analyzed and modified to significantly minimize the probability of the harm occurring.
Appendix A – Brief Summary Of Relational Risk Analysis
Relational risk analysis (ReRA) models a risk as a sequence of one or more system risk structure (SRS) elements shown in Figure A. The sequence describes how events are connected by mechanisms from an initiating cause event to a final consequence or objective event impacting a subject.
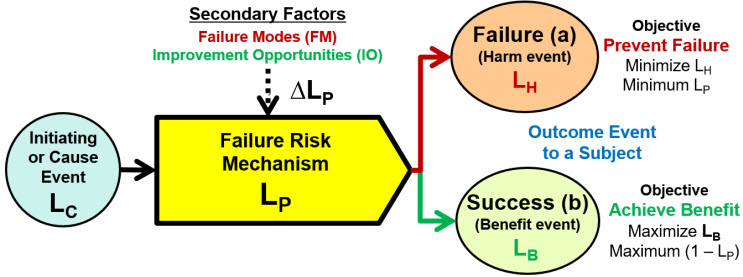
Figure A: Basic failure risk element of a ReRA system risk structure (SRS). The SRS element has two possible outcomes: preventing a failure (harm) or achieving a benefit event. The model’s probabilities are single-trial Bernoulli probabilities where LH + LB = 1. The risk relationship is modeled as LH = LC * LP; thus, LB = LC * (1 – LP). If the benefit risk is deliberately initiated, LC = 1. Secondary factors such as a failure mode can significantly impact LP.
For a harm risk, the objective is to make LP acceptably small given the severity of the harm event. For a benefit risk, the objective is to make (1 – LP) acceptably large given the value of the benefit. Additional discussion of ReRA’s principles can be found in the references.
The basic element can be used to describe continuous sequences of events connected by mechanisms to describe more complex risks. For example, executing a procedure initiates a sequence of steps to complete a final beneficial goal.2 The procedure SRS can be modelled as a combination of benefit risk to achieve the event for the following step or as a harm risk for modeling a piece of equipment’s failure rate. Table A1 provides a rating scale by which the two can be combined into a single sequence to calculate a final probability rating for successfully executing the entire procedure.
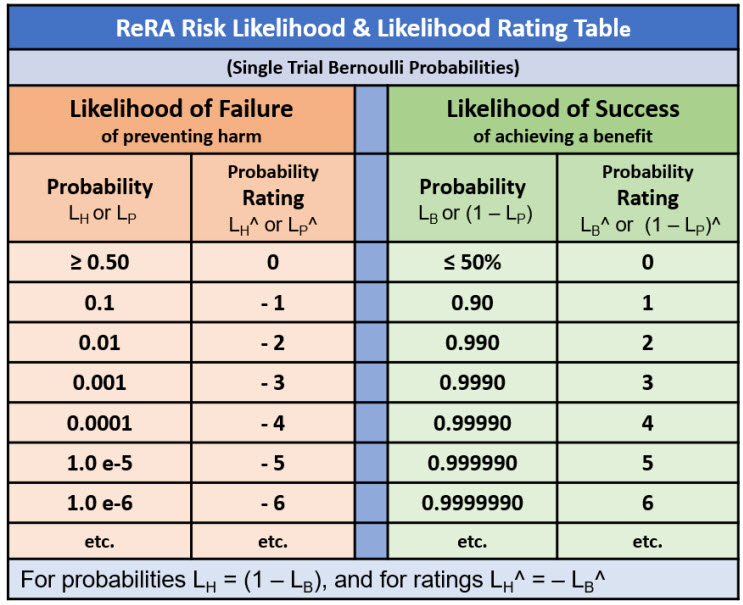
Table A1: Likelihood Table for ReRA probabilities. The table is constructed by calculating failure likelihoods LX^ = Log10(LX) for LX < 50%, then for all success likelihoods LX > 50% setting LX^ = – Log10(1 – LX^). For LX = 50%, LX^ = 0. Note that LX^ for both LX = 0 and LX = 1 are undefined.
Analyzing and communicating risks requires efficiently describing probabilities of both an events’ occurrence (LC, LH, or LB) and the mechanism’s LP values. Table A1 provides a very quick method of describing probabilities or probability ratings for efficient communications between analysis team members and decision makers.
For sequences of harm risk where LP is < 50%, the probability of the harm sequence is the sum of the ratings. In the case of benefit risk where LP are > 50%, the benefit sequence is the product of the probabilities, which can usually be estimated by a yield approximation as the minimum value of the LP or LP^ rating of the sequence. Benefit risks are in effect a yield problem of a sequence where the success rate yield is frequently defined by the lowest step yield in the sequence.
Reference
- Witcher, M.F., A New Approach for Minimizing Human Errors in Biopharmaceuticals and Medical Devices, Pharmaceutical Online, February 3, 2025. https://www.pharmaceuticalonline.com/doc/a-new-approach-for-minimizing-human-errors-in-biopharmaceuticals-and-medical-devices-0001
- Witcher, M.F., Using Relational Risk Analysis to Control Procedure Failures in the Bio/Pharma & Medical Device Industry, February 15, 2024. https://www.outsourcedpharma.com/doc/using-relational-risk-analysis-to-control-procedure-failures-in-the-bio-pharma-medical-device-industry-0001
- Witcher, M.F., A New Approach To ISO 14971 For Better Medical Device Risk Analysis, Med Device Online, October 23, 2024. https://www.meddeviceonline.com/doc/a-new-approach-to-iso-for-better-medical-device-risk-analysis-0001
- Witcher, M.F., Managing Supply Chain Risks Using Relational Risk Analysis, April 5, 2024. https://www.outsourcedpharma.com/doc/managing-supply chain-risks-using-relational-risk-analysis-0001
- Reason, J., Managing the risks of Organizational Accidents, Ashgate Publishing, 1997.
- Witcher, M.F, Expanding A Bow Tie Risk Analysis Model Using Relation Risks Analysis, June 2, 2025. https://www.pharmaceuticalonline.com/doc/expanding-a-bow-tie-risk-analysis-model-using-relational-risk-analysis-0001
About The Author:
 Mark F. Witcher, Ph.D., has over 35 years of experience in biopharmaceuticals. He currently consults with a few select companies. Previously, he worked for several engineering companies on feasibility and conceptual design studies for advanced biopharmaceutical manufacturing facilities. Witcher was an independent consultant in the biopharmaceutical industry for 15 years on operational issues related to: product and process development, strategic business development, clinical and commercial manufacturing, tech transfer, and facility design. He also taught courses on process validation for ISPE. He was previously the SVP of manufacturing operations for Covance Biotechnology Services, where he was responsible for the design, construction, start-up, and operation of their $50-million contract manufacturing facility. Prior to joining Covance, Witcher was VP of manufacturing at Amgen. You can reach him at witchermf@aol.com or on LinkedIn (linkedin.com/in/mark-witcher).