
Pfizer Case Study: Rapid Microbial Methods For Manufacturing Recovery After Hurricane María
By José-Miguel Montenegro-Alvarado, Joanny Salvas, Jeffrey Weber, Soraya Mejías, and Ramón Arroyo, Pfizer Inc.
Good manufacturing practices (GMPs) are a prerequisite for commercial production in the pharmaceutical industry. They are a basic set of requirements to ensure patient safety. For different reasons, GMP conditions may be lost, including, for example, as part of a planned shutdown for maintenance or construction or due to an unplanned disruptive event. This article shares a case study in which rapid microbiological methods (RMMs) were used to evaluate risk and expedite recovery of GMP conditions after the devastation of Hurricane María in Puerto Rico.
Category 4 Hurricane María hit the island of Puerto Rico in September 2017. According to the U.S. National Oceanic and Atmospheric Administration,1 María ranks as the third costliest U.S. storm on record overall and the costliest hurricane to strike Puerto Rico and the U.S. Virgin Islands, with an estimated total damage of $90 billion. The majority of commercial activities in Puerto Rico were disrupted due to damaged facilities and/or interruptions to power utilities, potable water supply, and communications — both externally and internally (land, air, and sea) — limiting supplies, etc. The challenge to fully recover GMP conditions to enable pharmaceutical manufacturing in a timely manner became critical for both the local economy and — most importantly — to ensure continued supply of life-saving drugs to patients worldwide.
Apparatus: Description Of Technologies
Biofluorescent particle counters (BFPCs) provide continuous measurement and quantification of internal biomarkers, allowing for the immediate detection and enumeration of microbes in manufacturing areas. Biofluorescent particle counting is a novel method that does not have a traditional microbial testing analog. Auto-fluorescence (also referred to as biological auto fluorescence) is based on the excitation of biological compounds that are ubiquitous to living cells such as microorganisms, like — for example — nicotinamide adenine dinucleotide (NADH), riboflavin, and dipicolinic acid. The excited molecules emit a light signal that can be picked up by the measurement system. Therefore, these novel measurement systems do not report results using growth-based colony forming units (CFUs); rather, it is an analytical signal of particle size and fluorescence resulting in an auto-fluorescence unit (AFU). There is a link between CFU and AFU, but not an exact correlation, due to several factors, including that many microorganisms are viable but nonculturable with traditional media. Biofluorescent particle counting technologies can be used for both air and water applications with adaption of system interfaces and flushing times.
Airborne BFPC systems are similar in approach to nonviable particle counters both in data handling and operations. The systems can be used with a “sampling tube” to enable the operator to scan regions to identify localized areas of higher microbial counts. Two systems using similar technology were used for air scanning: BioVigilant’s Instantaneous Microbial Detection for Air (IMD-A 350) apparatus2 and MicronView’s BioAerosol Monitoring System (BAMS)3 unit (refer to Figure 1).
Waterborne BFPC systems are similar technology, but “due to the increased complexity of an optical system for handling water compared to air, signals from particles and microbes are significantly lower and harder to detect in water,” which requires use of two photomultiplier tube (PMT) detectors to “discriminate particle signals based upon spectral content.”4 The system used for scanning purified water systems in this study is the BioVigilant Instantaneous Microbial Detection for Water (IMD-W) system.
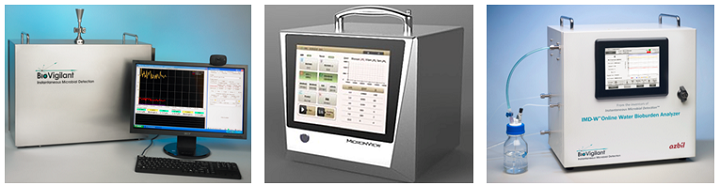
Figure 1: Technologies utilized for real-time bioburden monitoring in air and water media. Left: BioVigilant IMD-A system (Photo courtesy of Azbil North America, Inc. – BioVigilant Div.). Middle: MicronView BAMS system. Right: BioVigilant IMD-W system (Photo courtesy of Azbil North America, Inc. – BioVigilant Div.).
Leveraging Rapid Microbiological Methods: High-Level Strategies
The RMM technologies described were leveraged as part of the hurricane recovery plan, to enable a more efficient shutdown recovery. The information gathered was used for quick microbiological quality assessments to help evaluate risks and expedite GMP recovery efforts. The technologies were used in three main ways to generate key information to help guide remediation activities and ease business decision making as follows:
- Inspection of HEPA filters at the facilities’ supply side of the air handling units (AHUs) to identify filters that needed immediate remediation activities in order to prevent potential delays due to an eventual failed integrity test;
- Determination of airborne bioparticles in production rooms to ensure remediation activities were successful prior to releasing the rooms for compendial environmental sampling to conduct formal microbial release tests, and to identify rooms and AHUs that may have needed more work;
- Demonstrate effectiveness of sanitization and maintenance of purified water systems at the generation, supply, and loop return points to identify areas that may require additional remediation prior to formal microbial release tests and subsequent use.
Field Applications Approach And Sample Results: Tactical Deployment
Assessment of HEPA Filters’ Integrity
The inspection of the HEPA filters was performed to determine which filters were at greater risk of 1) failing the scheduled integrity test and 2) putting the manufacturing room at risk of contamination by not supplying clean air. Visual inspection alone would have been insufficient, and the use of the airborne BFPCs enabled enhanced inspection. The technologies identified at-risk filters that could be changed before the integrity testing, reducing delays and eventual repairs and retests after a potential failure.
The approach used did not replace the integrity test (or other official tests). It was used only to identify filters that were likely to fail so they could be changed proactively, allocating resources appropriately in times where they are scarce. The enhanced inspection was performed by using the BioVigilant IMD-A or the BAMS MicronView systems to verify the level of particles measured over the surface of the filter while clean air was being supplied. The systems were used with a tube extension to collect air at the supply side of the filter, over its whole area, by freehand scanning it in a linear-horizontal pattern. This approach was reproduced as systematically as possible in order to enable appropriate preventive maintenance to be assigned to the filters.

Figure 2: MicronView BAMS during HEPA scanning (left) and simplified schematic of scanning approach (right)
The data generated for all the filters of each targeted air handling unit was holistically analyzed and compared against a set of predetermined acceptance criteria/threshold values to establish filter status and make decisions on replacing individual HEPA filter(s) using a risk management approach. Filters with higher probability of failing the integrity test were prioritized for replacement over the ones that showed low probability of failing. This approach allowed efficient dispatch of available replacement parts and minimized delays due to stocking issues.
Assessment of Production Rooms for Environmental Air Microbial Quality
The second application leveraged the use of a BioVigilant IMD-A system and involved instant scanning of environmental air for bioburden assessment of processing rooms after general and GMP cleaning activities but before sampling the rooms for the traditional microbial quality release tests. Real-time measurement results from the system would provide information for quick business decision making to either perform additional cleaning activities or moving to conduct the traditional microbial release test sampling. This approach minimized the risk of failing the traditional microbial release tests without the need to wait for an incubation period of three to five days. It enabled readily identifying where to focus efforts if additional cleaning was necessary, empowered personnel, and, overall, provided for more efficient recovery processes.
This technology had been used previously in several of Pfizer’s plants as part of shutdown recovery activities. This enabled the use of established criteria to which the team could compare the room performance following the recovery activities and provided a good indication as to whether further remediation was required for each individual room. The report issued by the system at the end of each reading included the total amount of particles, the amount of large particles (>0.5µm), and the amount of bioparticles, which were compared to predetermined criteria. Data collection methods had been established as part of the initial projects and could be followed in this situation without any changes.

Figure 3: Sample reports summarizing RMM scanning results; sample passing test summary report shown on top; sample failing test summary report shown on bottom
Assessment of Bioburden in Purified Water Generation and Supply Systems
The BioVigilant IMD-W system was used for online evaluation of bioburden levels in purified water systems remediation and maintenance cycles. Monitoring the effectiveness based on microbial load was measured in real time at the generation, supply, and return sampling points. After measured bioburden levels were within acceptable values, the waters were sampled and tested using the traditional microbial methodology. The approach readily identified where additional remediation and/or maintenance cycles were needed without the need to wait for an incubation period and reduced the risk of failing the conventional test by sampling after attaining acceptable values for bioburden levels.
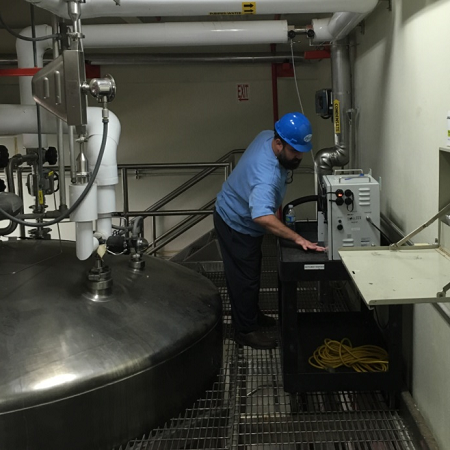
Figure 4: IMD-W installation in PW system
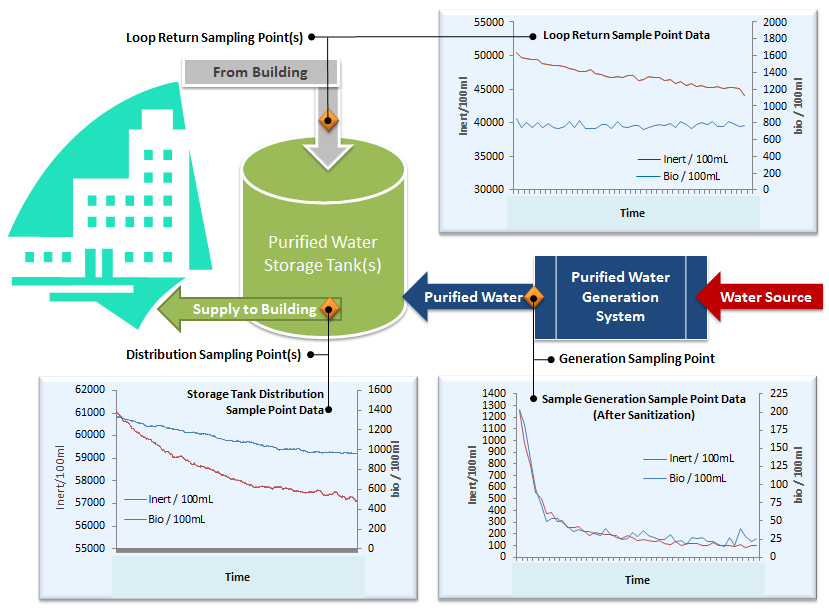
Figure 5: Sample bioburden data gathered online in real time during monitoring of a purified water system
Summary Of Benefits Of Using RMM Technologies
General benefits from using RMM technologies (for all applications described in this case study) include:
- Supported expedited identification and prioritization of areas needing further remediation by providing instant results (compared with traditional three to five incubation days for growth-based methods);
- Enabled efficient use of limited resources appropriately by identifying higher risk filters that needed replacement and water loops that needed additional sanitization prior to use;
- Avoided delays due to limited filter stocks and limited availability of inspection teams to perform failed inspections after a corrective maintenance;
- Enabled agile decision making and empowering personnel to take immediate corrective actions if results found above predetermined threshold values;
- Identified risks prior to quality release test failures and avoided additional delays;
- RMMs provide larger sample sizes, which can in turn reduce risk associated with single-point samples;
- Provided additional evidence to support moving at risk — if and when decided — after three-day reading of incubation plates for traditional quality release tests, as applicable.
Conclusion
This article describes the use of alternative rapid microbial methodologies during remediation activities at pharmaceutical manufacturing facilities after Hurricane María struck Puerto Rico in fall 2017. Several RMM technologies were successfully used to provide quick assessments of bioburden levels in both air and water, to reduce risks, and expedite recovery. More specifically, the technologies allowed for quick individual checks of the integrity of HEPA filter elements, provided real-time assessment of the microbial quality of environmental air in processing rooms, and enabled instantaneous bioburden assessment in purified water systems. Overall, RMM technologies provided numerous benefits inherent to their real-time measurement capabilities, ultimately helping expedite the recovery process, avoiding unnecessary costs as well as release test failures, and — most importantly — fast-track recovery to resume manufacturing and supplying life-saving medicines to patients worldwide.
Acknowledgements:
Many colleagues were directly and/or indirectly involved supporting the activities described in this article during design, preparation, and execution phases. This script only summarizes and shares a few samples of the actual work that collectively spanned more than two months. Although it is not possible to mention everyone, we would like to acknowledge the support and/or sponsorship of the following colleagues and leaders, without which the work would not have been possible: Gratitude goes to Luiz Antonio Cerciello, Orlando Bonano-Umpierre, José M. Rivera Ortiz, José Alvarez Ortiz, Mayra Meléndez Díaz, Nelson Amaro Alvarez, Iván Toledo Rosa, Santiago Senati Martínez, Janille Mercado, Camilo Campos, Gabriel Rosario, Diana Colón Astol, Gloriví Santiago Carrer, Seamus O’Neill, and Jean Sebastien-Simard. Thank you.
References:
- National Hurricane Center of the U.S. National Oceanic and Atmospheric Administration (January 26, 2018). Costliest U.S. Tropical Cyclones Tables Updated (pages 1-3). Electronically retrieved on February 8, 2018 from the National Hurricane Center / National Oceanic and Atmospheric Administration website at https://www.nhc.noaa.gov/news/UpdatedCostliest.pdf.
- BioVigilant Technical Paper (N.S.). Applications Concept: Use of an IMD-A® System for Personnel Training in Cleanroom and Aseptic Manufacturing Environments (page 1). Electronically retrieved on February 9, 2018 from BioVigilant website at http://biovigilant.com/wp-content/uploads/2014/07/Training.pdf.
- MicronView US (N.S.). Product – The Latest Design: BAMS (BioAerosol Monitoring System). Electronically retrieved on February 9, 2018 from MicronViewUS website at https://www.micronviewus.com/.
- BioVigilant Technical Paper (N.S.). Understanding Fluorescence Sensitivity: A Key Parameter in IMD-WTM Detection Performance (page 1). Electronically retrieved on February 9, 2018 from BioVigilant website at http://biovigilant.com/wp-content/uploads/2017/11/SensitivityIMDWFactSheetLI024092914.pdf.