
Rating Risk Events: Why We Should Replace The Risk Priority Number (RPN) With The Adjusted Risk Likelihood (ARL)
By Mark F. Witcher, Ph.D., biopharma operations subject matter expert
ICH Q9 – Quality Risk Management defines a risk as “the combination of probability of occurrence of harm and the severity of that harm.”1 ISO 31000 describes a risk as the “effect of uncertainty on objectives.”2 Both definitions include the significance of managing both a risk event’s uncertainty and impact. Thus, any risk rating system must preserve both attributes to the maximum extent possible.
The most common approach for rating risk events in the medical device and pharmaceutical industries is identified in ICH Q9 by failure mode and effect analysis (FMEA).3 FMEA rates risks using a risk priority number (RPN). Because the RPN has been widely used by the industry for many years, it has shaped the fundamental understanding of how a risk event’s severity and uncertainty are viewed and understood. The RPN is calculated as the mathematical product of numerical ratings from 1 to N of both a risk event’s severity (S) and likelihood of occurrence (L). In some cases, a detection rating (D), also rated from 1 to N, is included. The RPN is basically a severity rating with the numerical likelihood value used as a coefficient to increase the rating value for risks that have a higher likelihood of occurrence. The approach is generally valid because a more likely risk should be assigned a higher severity to increase its priority. The RPN does not have an absolute value because the Ns used for S, L, and D vary from one analysis to another. Thus, any specific RPN value has little meaning, eliminating its general utility to describe the importance of a risk event. In practice, a risk event’s RPN is never seen outside the context of the risk analysis that produced it.
While the RPN primarily represents a risk event’s severity, perhaps a more important attribute to focus on is the risk event’s likelihood of occurrence. For example, most people who must climb a ladder do not manage the severity of falling off a ladder. They manage the risk event by taking steps to decrease the likelihood of a fall. They check the condition of the ladder, place the ladder properly, climb it carefully, making sure to maintain proper balance, etc. All these risk management activities are intended to control the ladder and ladder climbing processes to decrease the likelihood of a fall. In general, the severity of most risks is relatively obvious and well defined, but the risk is controlled by taking steps to decrease the likelihood or probability that the risk event will occur. Thus, a risk event rating system that is more focused on a risk event’s likelihood of occurrence would better characterize a risk event.
The purpose of this article is to increase the industry’s understanding of risks and their management by proposing an adjusted risk likelihood (ARL) rating approach that emphasizes a risk event’s likelihood of occurrence. In addition, the proposed rating scales for severity and likelihood used to formulate the ARL have the sufficient range and reference points to support most of the risks seen in the industry. The ultimate goal is to provide a relatable rating value that can facilitate a common understanding of a risk event outside the immediate analysis that produced the rating value.
Severity Of A Risk Event
Describing the ARL rating approach begins by defining a relative severity rating as shown in Table 1.
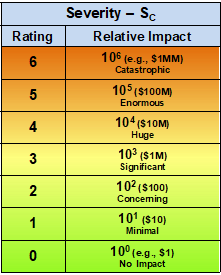
Table 1 – The severity of a risk event is evaluated and rated between 0 and 6 using a logarithmic scale that spans six orders of magnitude from essentially no impact or concern (0) to a catastrophic impact (6). For perspective, the scale is shown with monetary amounts that can be scaled up or down based on a reference point of the analyst’s definition of no or minimal impact.
For the purposes of this discussion, the functional range of both severity and likelihood of occurrence is assumed to be six orders of magnitude between the extreme values. Thus, a catastrophic event would have an impact of about a million times the level of an event that had no meaningful impact. The use of logarithmic scales is based on the Weber-Fechner law for measuring the human perception of physical phenomena. The Weber-Fechner law is also used to describe earthquakes, light and sound intensity, and tornadic activities.
Likelihood Of A Risk Event’s Occurrence
The second attribute is the probability or likelihood of the risk event’s occurrence. Because estimating likelihood is predicting the future, likelihood intrinsically has a considerable amount of subjective uncertainty. While both severity and likelihood are subject to uncertainty associated with beliefs and knowledge levels, likelihood by its very nature is uncertain. Beliefs contain various biases, prejudices, and potentially widely varying viewpoints. In any risk analysis the belief uncertainties must be controlled by assuming at least a minimal level of objectivity. The knowledge uncertainty must be controlled by assuming the risk analysis is being conducted by people with a level of knowledge and experience sufficient to deal with reasonably estimating both a risk event’s severity and likelihood of occurrence.
For likelihood of occurrence as shown in Table 2, the functional range is also set at six orders of magnitude. The upper limit of a probability scale can be naturally set at a rating of 0 for a probability of 1, or certain, as a reference point, similar to the zero rating reference point of the severity scale. The lower limit of the likelihood scale is set around one failure event per one million Bernoulli trials corresponding to a rating of -6. Estimating values below one occurrence per million opportunities becomes difficult, even to within an order of magnitude.
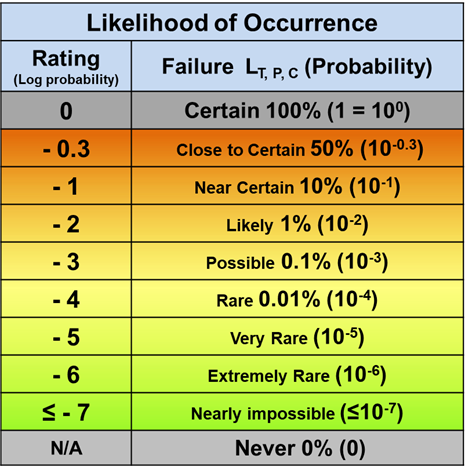
Table 2 – The likelihood of a risk event’s occurrence is rated by a logarithmic scale starting from the reference point of certainty at 100% as 0. The rating value is the logarithm of the probability of occurrence ranging from 0 (1 or 100) to less than or equal to -7 (≤ 10-7).
While the six orders of magnitude assumption may not be appropriate in all cases, it provides a useful range for both severity and likelihood of most risks seen in the pharmaceutical industry. Global warming might have a severity rating much higher than just a 6. However, the likelihood of its occurrence has increased to a near certainty such that global warming is not really a risk but a likely fact of life.
The likelihood of a risk event’s occurrence is a probability that must be expressed and manipulated as a probability ranging between 1 (certain) to 0 (impossible). Probabilities and thus likelihoods follow well-defined mathematical principles that must be used when dealing with probabilities. In theory, the likelihood rating could be extended beyond -6 for likelihoods that are extremely small. Such very low probabilities can be generated by redundant systems. For example, if a commercial airliner has two pilots, each with a probability of 10-6 of having a disabling health event during a flight, then the probability of both pilots becoming disabled at the same time, absent a common mode failure, would be roughly 10-12 corresponding to a likelihood rating of -12. Very low probabilities can also be generated by sequences of processes designed to control input risk events called threats. Building system risk structures (SRSs) designed to reduce the likelihood of risk events to very low levels can be used to build process control systems designed to mitigate risk events to very low likelihoods.4
Adjusted Risk Likelihood (ARL) Rating
If the severity rating shown in Table 1 and the likelihood rating shown in Table 2 are plotted together, then a heat map shown in Figure 1 can be generated. The heat map is similar to the heat maps created during an FMEA exercise by plotting the severity number against the likelihood of occurrence value.
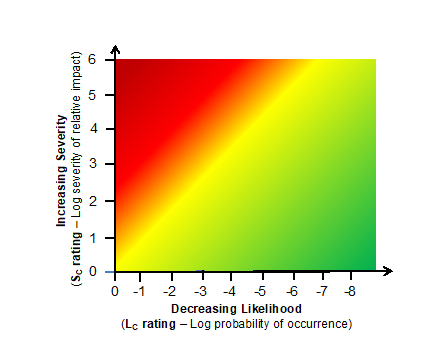
Figure 1 – Heat map based on the severity rating shown in Table 1 and likelihood of occurrence shown in Table 2.
The heat map provides a visual for understanding how an unacceptable risk event can be mitigated by decreasing the likelihood that a risk event will occur. Using a threat event – process – consequence event model for building system risk structures provides the mechanism for decreasing the likelihood of the risk event (consequence) from occurring by modifying the process or system that generates the risk event.4
If the severity rating shown in Table 1 is added to the likelihood rating shown in Table 2, an ARL number can be created. The ARL basically discounts the likelihood of the event’s occurrence based on the severity of the risk. Generally, risks with higher severity require lower likelihoods to reach an ARL that is acceptable. In general, the higher the severity of a risk event, the lower the likelihood of occurrence must be for acceptance.
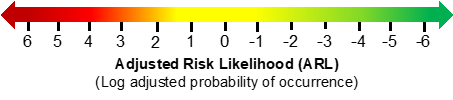
Figure 2 – ARL scale based on adding the Likelihood rating L and Severity rating S together to provide a single number.
The ARL is basically a severity weighted likelihood of occurrence. The number describes a balance between severity and likelihood, with a 0 rating being a possible balancing point. For example, using the cost value scale in the tables, an ARL of 0 is a 10% chance of losing $10 or a one in a million chance of losing $1 million. While the two financial risks are very different, the ARL gives you a first look at whether you are interested in accepting or mitigating the risk.
If you assess the risk of both pilots in an airliner becoming disabled at the same time as having a severity rating of 6 – catastrophic, then the risk event’s ARL would be -6. Given the number of people who fly on airplanes, most people obviously consider an ARL of -6 as acceptable. On the other hand, if airliners had a single pilot, the ARL would be 0, giving some passengers pause for concern with respect to accepting the risk of flying. In the case of global warming, the severity could be rated a 6 and the likelihood rated at 0, giving an ARL value of 6. Large ARLs do exist but should mostly be dealt with symptomatically by mitigating the impact as a fact of life rather than preventatively using risk management.
Conclusion
Contrary to common practice in the pharmaceutical industry of focusing on a risk event’s severity, a risk event’s most important attribute is its likelihood of occurrence. A risk event’s severity is relatively easy to assess by both the industry and regulatory agencies, but a risk event’s likelihood is more difficult to understand, evaluate, and proactively manage. While the severity of a risk event, once defined, is essentially fixed, most risk events are mitigated by decreasing the likelihood of their occurrence by modifying the processes that generate the risk events.
While the RPN has value only to people intimately familiar with the analysis that generated the value, the ARL has some intuitive basis for reaching a common understanding of a risk event’s potential impact. Clearly a risk with an ARL of 2 is very different than a risk with an ARL of -2. The larger the ARL, the greater the likelihood of a significant impact. The lower the ARL, the less likely the risk is to have an important impact. In general, defined risk events should be evaluated by both their severity and likelihood ratings, but the ARL provides a number to simply describe a defined risk event’s possible impact.
References
- FDA (CDER/CBER) – Guidance for industry: Q9 quality risk management. June 2006. ICH.
- ISO 31000:2018 – Risk Management – International Organization for Standardization.
- Carlson, C., Effective FMEAs: Achieving Safe, Reliable, and Economical Products and Processes using Failure Mode and Effect Analysis, 1st Edition, Wiley & Sons, 2012.
- Witcher, M. “System Risk Structures: A New Framework For Avoiding Disaster By Managing Risks,” Pharmaceutical Online, July 13, 2020 https://www.pharmaceuticalonline.com/doc/system-risk-structures-a-new-framework-for-avoiding-disaster-by-managing-risks-0001
About The Author:
 Mark F. Witcher, Ph.D., is a bioprocess operations expert in the Biopharma and Life Sciences Group at Exyte US. He has 35 years of experience in the biopharmaceutical industry in a wide variety of executive, consulting, and engineering roles. Prior to joining Exyte, Mark was a member of NNE’s Strategic Manufacturing Concept Group after working at IPS on feasibility and conceptual design studies for advanced biopharmaceutical manufacturing facilities. He has more than 25 years of experience as a consultant in the biopharmaceutical industry on operational issues related to product development, process validation, strategic business development, clinical and commercial manufacturing planning, tech transfer, and facility design. He was previously senior vice president of operations at Covance Biotechnology Services and vice president of manufacturing at Amgen, Inc.