
Revising Annex 1: A Case Study In Controlling Operating Risks By Understanding Uncertainty
By Mark F. Witcher, Ph.D., biopharma operations subject matter expert
All risks are a combination of severity of impact and the uncertainties associated with the probability of occurrence, the level of knowledge about the risk, and a wide variety of biases and beliefs of the people managing the risk. Some risks are appropriately managed with a focus on severity while others must be managed by understanding and controlling the probability of the risk’s occurrence. Risks evaluated and controlled based on severity or a poor understanding of the risk’s impact are frequently managed by the precautionary principle (PP).1 The most common definition of the PP is “better safe than sorry,” resulting in doing everything possible to prevent the risk from occurring with little or no analysis of the risk’s probability of occurrence. Global warming is a good example, because the consequences are thought to be catastrophic to mankind’s existence, making the likelihood of it occurring a secondary consideration.1
On the other hand, operational risks such as the risk of a contamination should be managed by controlling the likelihood of the failure through designing processes to prevent the contamination from occurring. Since the product must be manufactured, controlling the probability of a contamination is achieved by building a sequence of contamination control processes that prevent contamination from reaching the final output as defined by a specification. Because the acceptance of all contamination risks is defined by a criterion or specification, the severity only plays a role in deciding how low the likelihood of the contamination must be for accepting the risk.
Unfortunately, the pharmaceutical industry does not understand how to control a risk’s likelihood of occurrence. The current draft of EU’s Good Manufacturing Practices (GMPs) Annex 1 is an example of the industry’s focus on a risk’s severity while not understanding or evaluating a risk’s uncertainty and thus defaulting to using the PP for guidance.2 ICH Q9 describes methods that either do not treat uncertainty at all or use methods based on a risk priority number (RPN) that inappropriately combines uncertainty with severity.3 The RPN multiplies linearly scaled uncertainty and severity together, forming a bastardized severity rating that subsumes uncertainty as a weighting factor, thus discarding the primary tool for managing most pharmaceutical operating risks. Severity and uncertainty are fundamentally different and cannot be combined without losing the ability to utilize uncertainty’s important properties associated with being a probability. This article proposes a method for managing contamination risks as addressed in Annex 1 by appropriately controlling their probability of occurrence.
System risk structures (SRSs) provide a paradigm for understanding and controlling both a risk’s severity and uncertainty.4,5 Focusing on contamination risks, the SRS is based on the fundamental contamination risk element shown in Figure 1. A contamination risk is composed of a contamination threat that enters a contamination control process that produces a contamination consequence. All risks are composed of one or more threat-process-consequence (TPC) elements that can be structured into sequences and networks to describe how threats result in negative consequences, i.e., realized risks.
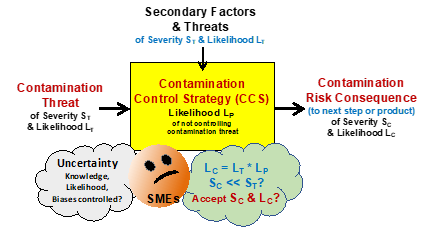
Figure 1: A basic threat-process-consequence (TPC) risk element shown as a threat with a severity ST and likelihood LT enters a process that has a likelihood LP of not controlling the threat to produce a possible consequence with a severity SC and likelihood LC. The likelihood that the consequence will occur is the mathematical product of the probability of LT and LP. Critical subject matter expert (SME) thought experiments are: What is the possible impact of the CCS’ secondary threats? Is there enough knowledge to estimate LT, LP? And, can the LC be accepted given the SC?
The TPC in Figure 1 is described by the following terms:
- Contamination Threat – an input contamination to the process with a severity of ST and a likelihood LT described as a probability of occurring. The threat comes from a prior process.
- Contamination Risk Consequence – an output contamination that might be a threat to a following process of a severity SC and likelihood LC. In the case of a process producing a final dosage form, the following process would be the patient. The only difference between a threat and a consequence is the process that produces it.
- Contamination Control Strategy (CCS) – the process that controls the input threat to prevent the resulting consequence. The probability of the CCS not preventing the consequence is the likelihood LP. A CCS that has a 99% probability of controlling the threat has an LC of 1%. Some processes will pass the threat without control (LP = 1) while others may provide an extremely high level of control (LP near 0). The CCS’ effectiveness LP can be significantly impacted by secondary factors or threats that influence the performance of the CCS.
- Secondary Factors & Threats – other inputs to the CCS process that might influence the process’ ability to control the threat. Secondary threats might include equipment and personnel failures such as errors in executing procedures. The cumulative impact of the secondary threats may play an important role in estimating the LP of the process. A CCS with many secondary threats may be determined to be less reliable, warranting a higher probability of not controlling the threat. Important secondary threats should be evaluated with their own TPC risk elements.
Figure 1 provides a framework for a team of SMEs to execute thought experiments to evaluate LP and accept or mitigate SC and LC in the context of the secondary threats that might influence the performance of the CCS. The thought experiments use the collective knowledge and experience of the SME team. The team may decide to gather additional information by experimentation, research, and adding additional expertise to better estimate LP.
One tool the SME team can use as a conceptual framework for understanding the causal relationships between the contamination threat, secondary threats, and the output consequence to estimate the LP likelihoods for a risk process is prospective causal risk modeling (PCRM).6 In some cases, the SME team may identify secondary threats or factors that may need additional control by adding or changing the processes that produce the secondary threat. In these cases, a separate TPC element can be constructed and added to the SRS framework to better understand and, when necessary, control the secondary threat.
A critical part of the thought experiments for understanding, estimating, and communicating likelihoods of a failure is to understand probabilities. Failure likelihoods are described as a probability of the failure passing through the CCS from a single event or control attempt from 1 (certain) to 0 (never). If the likelihood is estimated in terms of orders of magnitudes described in Table 1, then a simple description of the likelihood facilitates efficient analysis and communication of the risk’s TPC likelihoods.
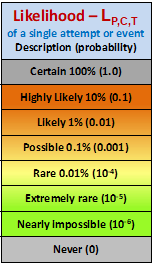
Table 1: Logarithmic likelihood of failure scale for a single execution attempt (Bernoulli trial) for estimating, calculating, and communicating TPC likelihoods. For activities that occur at very high rates, other probability distributions may be more appropriate.6 Demonstrating the most important property of probabilities is shown by the following example. If two TPC elements with an LP of Likely (0.01) are put in series, the combined LP (0.01 x 0.01) of the two is Rare (10-4).
The severity of a contamination varies widely depending on the type of contaminant and who or what is contaminated. While the possibility of a contamination during manufacturing can never be completely eliminated, it should be minimized to a level that is acceptable for the specific product being manufactured based on the type of contamination and its possible consequences to the patient. Thus, the severity only plays a role in deciding what is an acceptable likelihood of the contamination risk occurring beyond a specified limit.
Using the basic elements shown in Figure 1, the SRS of the CCSs in a contamination control system can be described.
Building A CCS’s System Risk Structure (SRS)
Figure 2 shows the basic structure of a larger CCS using the TPC elements shown in Figure 1. Important CCS systems can be evaluated using a simple element or the systems expanded into larger sequences and networks of individual CCS TPC elements depending on the importance of the overall risk consequence and the depth of analysis and risk management required. For example, an isolator located within a suite of cleanrooms will have a sequence of CCSs designed to protect the product.
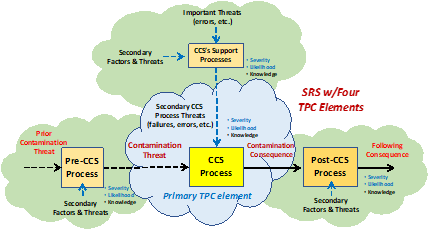
Figure 2: An SRS for a CCS system using TPC risk elements shown in Figure 1. Using the SRS approach, complex CCS systems can be evaluated for a wide variety of threats, including both the primary contamination threat and important secondary threats such as a failure to properly use aseptic methods, equipment failures, or interrupted airflows, etc. The figure shows the primary TPC along with three adjacent TPCs that describe the source of the primary threat, the consequence’s threat to a following process, and the TPC for an important secondary threat needing further understanding.
The discussion will begin by looking at a simple CCS example and how a contamination threat can flow through a series of CCS processes to result in a realized contamination consequence.
Contamination Example – Person To Person SARS-CoV-2 Infection
A timely example of CCSs is controlling the transmission of novel SARS-CoV-2 virus between two people.7 As shown in Figure 3, an SRS can be assembled to show three possible CCSs to prevent person A on the left from infecting person B on the right. For the sake of this discussion we will simply evaluate the uncertainty of various CCS processes with the acceptance criteria determined by person B’s beliefs of the severity of the COVID-19 disease. Those beliefs and acceptable probabilities might be significantly different if the much more deadly Ebola virus was being controlled instead of the SARS-Cov-2 virus.
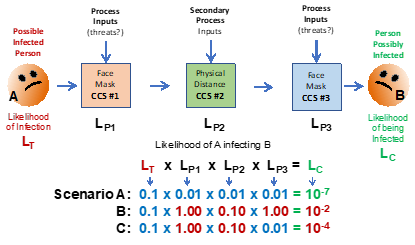
Figure 3: An SRS for the risk of airborne infection of SARS-CoV-2 virus from person A to person B. Since person B is the subject of the contamination risk, whether the likelihood of infection LC is acceptable is defined by their thought experiments that assess each CCS and their cumulative likelihoods either individually or collectively. Person B’s risk assessment may vary widely depending on their biases, fears, experience, or knowledge of each CCS and their perception of the infection’s severity SC.
Using basic laws of probabilities, the likelihood of person A infecting person B is the mathematical product of the likelihoods shown. For systems of CCSs, this demonstrates the principle of “compounding sequential probabilities” that must be considered when building contamination control systems. The likelihood of a threat producing the consequence and the risk’s severity can decrease significantly as the threat passes through a sequence of CCS processes. The likelihood estimates used in the examples below are of those guessed by the author for demonstration purposes only. Obviously, the likelihoods of various processes controlling threats is a complex subject amenable to considerable analysis, experimentation, and discussion by qualified experts. Because estimating likelihoods of future events is a subjective guess, it can be impacted by a large number of highly subjective factors including, biases, beliefs, experience, and other factors discussed elsewhere.6
In the following discussions, the probabilities or likelihoods will only be estimated by orders of magnitude using Table 1 in a manner similar to the logarithmic scales used for estimating the severity of earthquakes, light intensity, and other phenomena based on human perception. Under most circumstances, order-of-magnitude estimates are sufficient given the subjectivity of the acceptance decision associated with guessing the possibility of future events.
Three scenarios using Figure 3 demonstrate the impact of uncertainty that must be evaluated and managed to control the risk of person A infecting person B. The likelihood of person A being infected but not showing any symptoms is conservatively assumed to be 10%, or a probability of 0.1. For illustrating the concept, the following three scenarios are described and the calculations shown in Figure 3:
Scenario A: All three CCSs are in place with the following likelihoods assumed to be LP1 = 0.01 (mask on person A is 99% effective), LP2 = 0.01 (outside distance of 6 feet is 99% effective), LP3 = 0.01 (mask on person B is 99% effective), giving an LC of 10-7 or one chance in 10 million interactions. Of course, all three CCSs are assumed to be functioning as intended.
Scenario B: None of the CCS are in place, thus LP1 = 1.0, LP2 = 0.1 (less than 2 feet of distance inside), and LP3 = 1, giving a likely contamination LC of 1% or 0.01. Thus, not using the three CCS systems increases the likelihood of infection from 1 in 10 million to about 1 in 100.
Scenario C: Person A is not wearing a mask close to person B, who is wearing a mask, making the likelihoods of LP1 = 1 (no mask), LP2 = 0.1 (distance of 2 feet), and LP3 = 0.01 (mask), giving an LC of 10-4, or one chance in 10,000 interactions. Thus, person B is much better off wearing a mask if other CCSs are not used.
Given the assumptions, the three scenarios show the effectiveness of using personal protective strategies for controlling the possibility of being infected. Given the analysis shown, person B can make an informed decision on their likelihood of being infected in various situations and may decide to alter the physical distance process (LP2) in order to better control the probability of catching COVID-19 disease.
But building effective CCS requires understanding and managing secondary threats in the form of process changes that may either positively or negatively impact the performance of each CCS process. The three processes shown in Figure 3 are subject to some or all of the following uncertainties:
Threat Likelihood (LT) – A person that is showing symptoms or has tested positive may have a threat likelihood LT of 1.0. Those who have tested negative may have a lower LT. Thus, the CCS system for hospital care of COVID-19 victims may be significantly different than casual interactions between people.
Person A’s Mask – Masks have differing effectiveness depending on their type (N95, cloth, etc.) and how well they are worn, e.g., not covering the nose. The mask’s effectiveness may also be impacted by person A being a super spreader shedding large amounts of virus in water droplets by shouting, coughing, singing, or sneezing.
Physical Distance – The physical distance can be impacted by many factors, including indoors vs. outside, airflow direction, air filtration, etc. It may also be significantly impacted by the duration that person A and B are near each other.
Person B’s Mask – Like person A’s mask, many factors may impact the likelihood of it controlling airborne viral particles.
The final process, not included in this analysis, is the impact of the possible infection. The real consequence to consider is the risk of significant COVID-19 disease. As with all contamination risks, the likelihood of the final “patient process” is not considered directly, but a complete analysis in deciding on a CCS’ acceptance might also include the final risk element of the contamination control process, the impact on the patient. Evaluating the patient process with respect to the impact is an extremely complex medical analysis and subject to extremes in personal biases and human judgement and is beyond the scope of this article and most engineering-based risk assessments.
The same principles shown in Figure 3 apply to much more complex Annex 1 CCSs provided by gowning, cleanrooms, cleaning procedures, laminar flow hoods, RABS (restricted access barrier systems), isolators, and various combinations of CCSs to protect pharmaceutical products. Threats that might be evaluated are sources such as personnel, components, raw materials, incoming or recirculated air streams, process contaminants, etc. In order to build efficient and effective CCSs to protect the product, and thus protect the patients, SRSs should be constructed for each CCS system by describing and understanding the flow of various contamination and secondary threats for achieving an acceptable level of control.
The CCS control requirements described in Annex 1 provide a wide variety of control strategies. These requirements should be carefully selected and assembled based on an SRS describing specific situations. When too many regulatory requirements are mandated, they may reduce the likelihood far beyond what is necessary even for contaminants that have severe consequences. Or, in some cases, the excessive requirement may hide important secondary threats, resulting in a lower overall effectiveness of the complete CCS system.
For example, Annex 1 has the following requirement:
5.8 A conveyor belt should not pass through a partition between a Grade A or B area and a processing area of lower air cleanliness, unless the belt itself is continually sterilized (e.g., in a sterilizing tunnel).2
Does the sterilization requirement meaningfully lower the likelihood of a contamination threat beyond other CCSs in the system? Can an acceptable level of LC be achieved without the belt sterilization? Given its significant capital and operational investment, does the requirement make any sense in the context of all the other CCS processes in place? While there is a provision in Annex 1 for removing 5.8 in a top-down justification exercise, it makes a lot more sense and is much more efficient to add steps like 5.8 during the CCS life cycle development to achieve a required level of control based on the judgement of experts building and documenting the CCS using SRS quality risk management (QRM) methods.
Using SRS as a tool for managing contamination threats by building CCSs is only the first tool required to meet Annex 1’s requirements. The second tool manages the CCS’ entire design and operational life cycle.
Building A CCS’ Life Cycle
Figure 4 briefly describes the life cycle of a CCS system using life cycle process development and validation (LPDV) concepts.8,9,10 The CCS system is initially defined in Stage 0 by identifying the output specifications, threats to be controlled, and the control methods and processes. SRS methods are then used to provide a sufficient level of control in Stage 1-1 using the likelihood calculation methods described previously. By understanding the likelihoods of the threats and the likelihoods of the CCS processes to control the threats, an appropriate sequence of CCS processes can be assembled and integrated to build the overall CCS system to achieve the required level of control to meet the specifications.
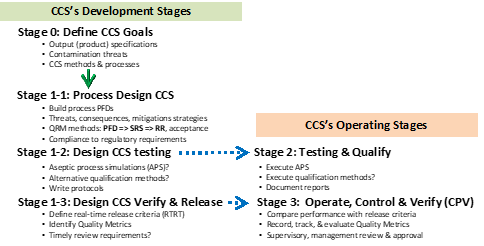
Figure 4: The life cycle process development & validation (LPDV) paradigm summary for developing contamination control strategies (CCSs).10
Annex 1 places a great deal of emphasis on the entire CCS’ life cycle. Annex 1 requires that every CCS be properly designed to reduce contamination risks to an acceptable level, be appropriately tested to assure that CCSs function as they are designed, and then be monitored during operation to assure that they functioned properly. The life cycle stages shown in Figure 4 achieves those requirements.
The initial LPDV stage 0 defines the CCS’ objectives and goals, including defining appropriate specifications. Stage 1 designs the CCS processes to meet the stage 0 goals by using SRS-based QRM methods. In some cases, the goals may include an estimated specification for the CCS’ likelihood of achieving the specified criteria, much like sterilization or sanitization cycles can be defined in terms of a log kill criteria.
While stage 1-1 is being executed, how the CCS will be tested and documented is defined in stage 1-2 to assure the required testing and qualification of the CCS system. CCSs must be tested, frequently using aseptic process simulations (APS) that primarily test the manufacturing enterprise’s ability to operate the CCS during worst-case secondary threat situations. APS methods perform a similar function as PPQ (process performance qualification) lots by qualifying a manufacturing operation’s ability to execute the CCS processes rather than actually testing the CCS’ processes themselves.
At the same time, stage 1-3 is building the ongoing methods for operating, verifying, and releasing the CCS systems during normal operation. At the completion of stage 1, the methods and approaches for both the stage 2 qualification and stage 3 verification should have a high degree of assurance they will be successful when they are executed.
How To Improve Annex 1
The current draft of Annex 1 does not use effective QRM methods but instead requires a wide variety of contamination control measures that are based primarily on using the precautionary principle to do everything possible to prevent contamination risks. To be effective, Annex 1 must allow for the use of straightforward rigorous QRM methods that manage both the severity and probability. While severity to the product and patients is a measure of the contamination’s importance, CCS processes must be assembled, integrated, and evaluated based on both the likelihood of the contamination occurring and the changing level of contamination as it passes through the CCS systems. This article proposes using an SRS QRM approach that describes and manages the sequence of CCSs and their cumulative impact on reducing the likelihood of contamination. While Annex 1 describes many CCS methods as requirements, those methods should be selected and combined to provide effective contamination control without either under or overcontrolling the threats. The CCS’ SRS must also identify and evaluate secondary threats that include the performance of equipment and people in executing the designed CCS’ functions. By building the necessary SRS for analyzing and controlling important secondary risks, the total CCS network can include all the risk elements necessary to reliably achieve highly effective aseptic processing.
If the CCSs are assembled using LPDV methods, the entire CCS’ life cycle, as required in Annex 1, can be effectively defined and designed such that it can be tested and operated with a high degree of assurance that the CCS will begin and remain effective in controlling the contamination that threatens the quality of the product. The most effective testing and operational methods can only come if they are designed into the processes as the processes themselves are being designed, assembled, and integrated into a complete CCS system.
With the appropriate tools, aseptic experts and regulatory agencies can reach the necessary consensus and agreement on what CCSs are appropriate for specific applications. That agreement and consensus must come by reducing the likelihood of the contamination to an acceptable low level based on the patient severity of the contamination. As the use of these tools becomes more widespread, more effective and efficient methods will become standard “best practices” to the benefit of the industry, regulatory agencies, and, most importantly, the patients.
References:
- Sunstein, C., Laws of Fear: Beyond the Precautionary Principle, Cambridge Press, 2005
- European Commission, EudraLex, Volume 4, EU Guidelines to Good Manufacturing Practice Medicinal Products for Human and Veterinary Use, Annex 1, Manufacture of Sterile Medicinal Products, consultation document, December 2017
- FDA (CDER/CBER) – Guidance for industry: Q9 quality risk management (QRM). June 2006. ICH
- Witcher, M. F., System Risk Structures: A New Framework for Avoiding Disasters by Managing Risk, BioProcess Online, July 13, 2020. https://www.pharmaceuticalonline.com/doc/system-risk-structures-a-new-framework-for-avoiding-disaster-by-managing-risks-0001
- Witcher MF. Analyzing and managing biopharmaceutical risks by building a system risk structure (SRS) for modeling the flow of threats through a network of manufacturing processes. BioProcess J, 2017; 16. https://doi.org/10.12665/J16OA.Witcher
- Witcher MF. Estimating the uncertainty of structured pharmaceutical development and manufacturing process execution risks using a prospective causal risk model (PCRM). BioProcess J, 2019; 18. https://doi.org/10.12665/J18OA.Witcher
- Witcher, M. F., What managing personal SARS-CoV-2 risks can teach us about managing pharmaceutical risks, BioProcess Online, June 12, 2020. https://www.pharmaceuticalonline.com/doc/what-managing-personal-sars-cov-risks-can-teach-us-about-managing-pharma-risks-0001
- Witcher MF. Integrating development tools into the process validation lifecycle to achieve six sigma pharmaceutical quality. BioProcess J, 2018; 17. https://doi.org/10.12665/J17OA.Witcher.0416
- Witcher, M. F., A Functional History of Process Validation: Part I – A Less than Sufficient Past & Present, BioProcess Online, August 7, 2020. https://www.pharmaceuticalonline.com/doc/a-functional-history-of-process-validation-part-a-weak-foundation-0001
- Witcher, M. F., A Functional History of Process Validation: Part II – A more Effective Future, BioProcess Online, August 14, 2020. https://www.pharmaceuticalonline.com/doc/a-functional-history-of-process-validation-part-the-key-to-a-more-effective-future-0001
About The Author:
 Mark F. Witcher, Ph.D., has over 35 years of experience in biopharmaceuticals. He currently consults with a few select companies. Previously, he worked for several engineering companies on feasibility and conceptual design studies for advanced biopharmaceutical manufacturing facilities. Witcher was an independent consultant in the biopharmaceutical industry for 15 years on operational issues related to: product and process development, strategic business development, clinical and commercial manufacturing, tech transfer, and facility design. He also taught courses on process validation for ISPE. He was previously the SVP of manufacturing operations for Covance Biotechnology Services, where he was responsible for the design, construction, start-up, and operation of their $50-million contract manufacturing facility. Prior to joining Covance, Witcher was VP of manufacturing at Amgen. You can reach him at witchermf@aol.com or on LinkedIn.