
7 Rules For Properly Interpreting Control Charts
By Mark Durivage, Quality Systems Compliance LLC

Control charts build upon periodic inspections by plotting the process outputs and monitoring the process for special cause variation or trends. Control charts are decision-making tools that provide information for timely decisions concerning recently produced products.
Control charts can be used to identify sources of variation, both common and special cause. Common cause variation is the variation inherent in the process. Common cause variation is also known as the noise of the process. A process with only common cause variation is highly predictable. A process that has a significant inherent common cause variation may not be capable of producing products that meet predetermined specifications. Common cause variation is said to account for 80% of the variation in any process and is considered management’s responsibility.
Special cause variation is variation that is not inherent to the process. A process with special cause variation is highly unpredictable. Special cause variation is said to account for 20% of the variation in any process and is considered the worker’s responsibility.
Control charts contain a centerline — usually the mathematical average of the samples plotted — and upper and lower statistical control limits that define the constraints of common cause variation and performance data plotted over time.
There are two general classifications of control charts: variables and attributes charts. Variables are things that can be measured. Attributes are things that can be counted. The type of data (variable or attribute) will dictate the appropriate type of control chart required to monitor a process. Table 1 can be used for control chart selection.
Table 1: Control Chart Selection Guide

Selection of the correct type of control chart is important to ensure the underlying statistical concepts are appropriate for the feature or attribute being measured.
A process is said to be in control when the control chart does not indicate any out-of-control condition and contains only common causes of variation. If the common cause variation is small, then a control chart can be used to monitor the process. If the common cause variation is too large, the process will need to be modified or improved to reduce the amount of inherent variation to an acceptable level.
When a control chart indicates an out-of-control condition (a point outside the control limits or matching one or more of the criteria in the rules below), the assignable causes of variation must be identified and eliminated.
The following rules can be used to properly interpret control charts:
- Rule 1 – One point beyond the 3 σ control limit
- Rule 2 – Eight or more points on one side of the centerline without crossing
- Rule 3 – Four out of five points in zone B or beyond
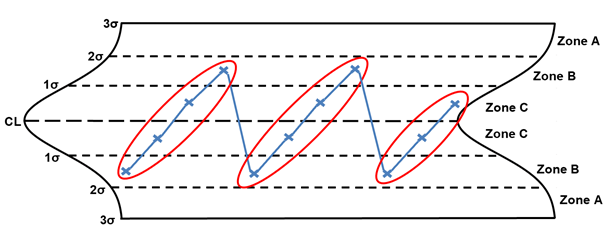
- Rule 4 – Six points or more in a row steadily increasing or decreasing
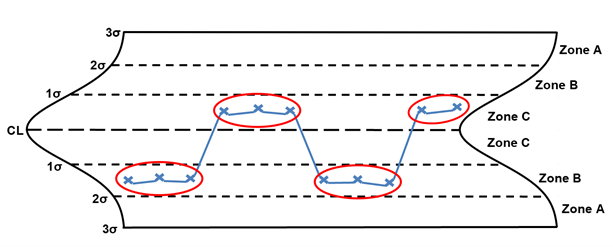
- Rule 5 – Two out of three points in zone A
- Rule 6 – 14 points in a row alternating up and down
- Rule 7 – Any noticeable/predictable pattern, cycle, or trend
Analyzing a control chart for special cause variation can be facilitated by using the categories used with a cause-and-effect diagram. The flowing are the categories that I prefer to use:
- Equipment, Machines, and Tooling
- Environment
- Process
- Inspection
- Materials
- Operator
Rule 1 – One point beyond the 3 σ control limit

Rule 1, one point beyond the 3 σ control limits, seeks to identify points that are random or outliers, as shown here in red. When random or outlier points are identified, the following are potential special causes to consider:
- Equipment, Machines, and Tooling
- improper start-up
- improper setup
- sudden support system failure (cooling, heating, compressed air, vacuum, steam, etc.)
- tool failure/breakage
- equipment or machine failure
- improper equipment, machine, and tooling maintenance
- utility interruption
- Environment
- temperature suddenly too low/high
- humidity suddenly too low/high
- Process
- equipment has not stabilized (warmed-up)
- inadequate work instructions
- missed process step
- new process
- Inspection
- inspection, measuring, and testing equipment not properly calibrated
- damaged inspection, measuring, and testing equipment
- Materials
- change in raw materials
- change in components
- handling damage
- expired materials
- Operator
- new operators
- inadequate training
- operator interrupted or distracted
- operator overcompensating when making process adjustments
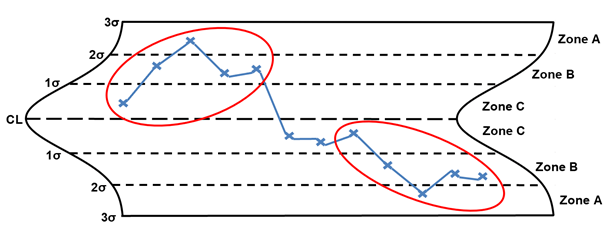
Rule 2 – Eight or more points on one side of the centerline without crossing
Rule 2, eight or more points on one side of the centerline without crossing, is considered a prominent shift (the shift can be on either side of the centerline). The points circled in red are considered a prominent shift. When a prominent shift is identified, the following are potential special causes to consider:
- Equipment, Machines, and Tooling
- improper setup
- improper equipment, machine, and tooling maintenance
- damaged tooling
- tool wear
- Environment
- temperature shifted too low/high
- humidity shifted too low/high
- Process
- new process parameters
- incorrect process parameters
- process has improved
- process has degraded
- Inspection
- inspection, measuring, and testing equipment not properly calibrated
- damaged inspection, measuring, and testing equipment
- Materials
- change in raw materials
- change in components
- expired materials
- Operator
- new operators
- inadequate training
- operator interrupted or distracted
- shift change
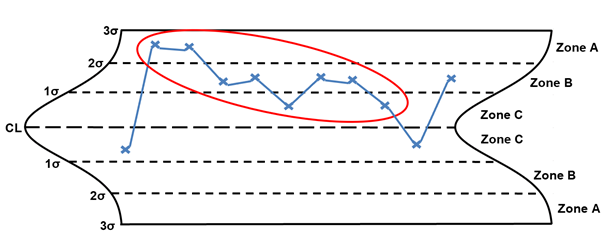
Rule 3 – Four out of five points in zone B or beyond
Rule 3, four out of five points in zone B or beyond, is considered a small shift (the shift can be on either side of the centerline). The points circled in red are considered small shifts. When a small shift is identified, the following are potential special causes to consider:
- Equipment, Machines, and Tooling
- improper setup
- intermittent support system failure (cooling, heating, compressed air, vacuum, steam, etc.)
- improper equipment, machine, and tooling maintenance
- Environment
- temperature suddenly too low/high
- humidity suddenly too low/high
- Process
- new process parameters
- incorrect process parameters
- process has improved
- process has degraded
- Inspection
- inspection, measuring, and testing equipment not properly calibrated
- inspection, measuring, and testing equipment not adequate for the intended use
- damaged inspection, measuring, and testing equipment
- Materials
- mixed raw materials
- mixed components
- Operator
- new operators
- inadequate training
- operator interrupted or distracted
- shift change
Rule 4 – Six points or more in a row steadily increasing or decreasing
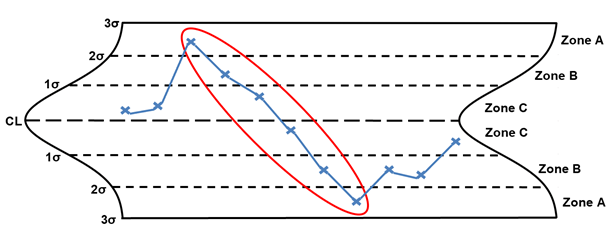
Rule 4, six points or more in a row steadily increasing or decreasing, is considered a trend (the trend can be rising or falling). The points circled in red are considered a trend. When a trend is identified, the following are potential special causes to consider:
- Equipment, Machines, and Tooling
- gradual support system failure (cooling, heating, compressed air, vacuum, steam, etc.)
- tool wear
- Environment
- temperature gradually drifting too low/high
- humidity gradually drifting too low/high
- Process
- process is slowly degrading
- Inspection
- inspection, measuring, and testing equipment not adequate for the intended use
- damaged inspection, measuring, and testing equipment
- Materials
- variation in the raw materials
- variation in the components
- Operator
- operator distracted
Rule 5 – Two out of three points in zone A
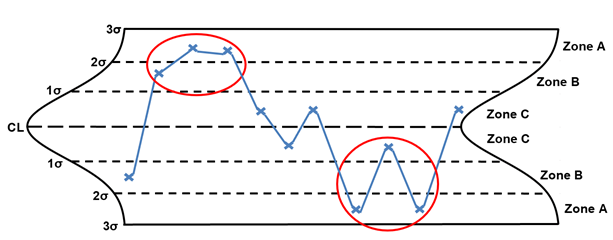
Rule 5, two out of three points in zone A, is considered a large shift. (the shift can be on either side of the centerline). The points circled in red are considered large shifts. When a large shift is identified, the following are potential special causes to consider:
- Equipment, Machines, and Tooling
- improper setup
- support system failure (cooling, heating, compressed air, vacuum, steam, etc.)
- improper equipment, machine, and tooling maintenance
- Environment
- temperature suddenly too low/high
- humidity suddenly too low/high
- Process
- new process parameters
- incorrect process parameters
- process has degraded
- Inspection
- inspection, measuring, and testing equipment not properly calibrated
- inspection, measuring, and testing equipment not adequate for the intended use
- damaged inspection, measuring, and testing equipment
- Materials
- mixed raw materials
- mixed components
- Operator
- new operators
- inadequate training
- operator interrupted or distracted
- shift change
Rule 6 – 14 points in a row alternating up and down
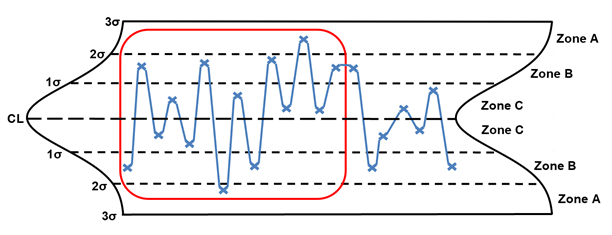
Rule 6, 14 points in a row alternating up and down, is generally considered to be overcontrol. The points enclosed in red are considered out of control. When this situation is identified, the following are potential special causes to consider:
- Equipment, Machines, and Tooling
- improper setup
- intermittent support system failure (cooling, heating, compressed air, vacuum, steam, etc.)
- improper equipment, machine, and tooling maintenance
- Environment
- temperature intermittently too low/high
- humidity intermittently too low/high
- Process
- equipment has not stabilized (warmed-up)
- new process parameters
- incorrect process parameters
- inadequate work instructions
- missed process step
- new process
- Inspection
- inspection, measuring, and testing equipment not adequate for the intended use
- damaged inspection, measuring, and testing equipment
- Materials
- mixed raw materials
- mixed components
- Operator
- new operators
- inadequate training
- operator overcompensating when making process adjustments
- operator not waiting for the process to stabilize before making process adjustments
Please note, even though the operator may be over adjusting the process, there may be other special causes present.
Rule 7 – Any noticeable/predictable pattern, cycle, or trend
Rule 7 is any noticeable/predictable pattern, cycle, or trend. The points circled in red are considered out of control. When these situations are identified, the following are potential special causes to consider:
- Equipment, Machines, and Tooling
- improper setup
- intermittent support system failure (cooling, heating, compressed air, vacuum, steam, etc.)
- gradual support system failure (cooling, heating, compressed air, vacuum, steam, etc.)
- improper equipment, machine, and tooling maintenance
- tool wear
- Environment
- temperature gradually drifting too low/high
- humidity gradually drifting too low/high
- temperature shifted too low/high
- humidity shifted too low/high
- temperature intermittently too low/high
- humidity intermittently too low/high
- Process
- equipment has not stabilized (warmed-up)
- new process parameters
- incorrect process parameters
- inadequate work instructions
- missed process step
- new process
- two or more processes
- Inspection
- inspection, measuring, and testing equipment not properly calibrated
- inspection, measuring, and testing equipment not adequate for the intended use
- damaged inspection, measuring, and testing equipment
- Materials
- change in raw materials
- change in components
- mixed raw materials
- mixed components
- variation in the raw materials
- variation in the components
- Operator
- new operators
- inadequate training
- operator interrupted or distracted
- multiple shifts
Stratification
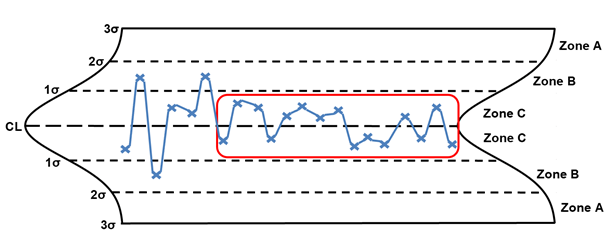
When stratification is identified, it is generally due to one of two issues. The operators are purposefully truncating the measurements, or the process has improved significantly, which will require the recalculation of the statistical control limits.
Conclusion
It is time to consider augmenting your validated pharmaceutical, medical device, and tissue production processes, including processing, packaging, and labeling, with continuous process monitoring using control charts to ensure continued compliance with established specifications and requirements.
When implementing control charts as part of your continuous process monitoring activities, ensure the people responsible for completing the charts have been properly trained and understand the seven rules presented in this article.
I cannot emphasize enough the importance of establishing documented procedures to manage the tools and methods used. Best practice includes providing the rationale for your organization’s use of control charts for continuous process monitoring. The methods and tools presented in this article can and should be utilized based upon industry practice, guidance documents, and regulatory requirements.
References:
- Durivage, M.A., 2014, Practical Engineering, Process, and Reliability Statistics, Milwaukee, ASQ Quality Press
- Durivage, M.A., and Mehta, B., 2016, Practical Process Validation, Milwaukee, ASQ Quality Press
- Durivage, M.A., 2020, https://www.pharmaceuticalonline.com/doc/how-to-implement-continuous-process-monitoring-of-validated-processes-0001
About The Author:
 Mark Allen Durivage has worked as a practitioner, educator, consultant, and author. He is managing principal consultant at Quality Systems Compliance LLC, an ASQ Fellow and SRE Fellow. Durivage primarily works with companies in the FDA regulated industries (medical devices, human tissue, animal tissue, and pharmaceuticals), focusing on quality management system implementation, integration, updates, and training. Additionally, he assists companies by providing internal and external audit support as well as FDA 483 and warning letter response and remediation services.He earned a BAS in computer aided machining from Siena Heights University and an MS in quality management from Eastern Michigan University. He holds several certifications including CRE, CQE, CQA, CSSBB, RAC (Global), and CTBS. He has written several books available through ASQ Quality Press, published articles in Quality Progress, and is a frequent contributor to Life Science Connect. You can reach him at mark.durivage@qscompliance.com and connect with him on LinkedIn.