
Statistical Methods For Comparing Small-Scale Models To At-Scale Biopharmaceutical Manufacturing
By Joschka Johannes Buyel (Bayer AG), Klaus Kaiser (Bayer AG), Kiran Andra (Alexion), Robert G. Luo (GlaxoSmithKline R&D), Alexis Henry (Biogen), Caroline Leveder (Sanofi R&D), Mark Richards (Eisai Inc.), Trish Connolly (BioPhorum Development Group)

This article is the final in a three-part series that summarizes the discussions and exchanges of a BioPhorum Development Group workstream on small-scale model justification. Their purpose is to provide reference documents for bioprocess professionals who will carry out small-scale model justification. In order to write the articles, surveys were conducted among BioPhorum workstream team members on the practices of conducting small-scale model justification. Part 1 discussed the applications, including viral clearance, quality oversight, and design considerations, for justification of SSMs. Part 2 covered the current opinion on how to execute small-scale model qualification for both upstream and downstream SSMs and analytical setup. This part discusses statistical methods for comparing SSM outputs to at-scale outputs and covers descriptive statistical methods, inferential methods, difference tests, equivalence tests, quality range methods, and multivariate analysis. The results of the surveys are not presented in these articles but are available in an expanded BioPhorum white paper on the topic.1
Descriptive Statistical Methods
Descriptive statistics are often the most important part of the statistical contribution to SSMQ. The type of descriptive statistics to be applicable depends on how the data is collected. One example is a non-satellite study where independent data sets from both scales are analyzed. On the contrary, satellite studies have paired samples where differences between each SSM output and its corresponding at-scale outputs are analyzed (see section 7.0 of the full white paper1).
In general, descriptive statistics, in particular scatter plots, are extremely useful to both SMEs and health authorities in making a qualification assessment.
Inferential Statistical Methods
Statistical inference is the art of inferring characteristics of a population from results obtained from a sample data set drawn from the population. The SSM and at-scale outputs over a product’s lifetime are the populations for which to infer the comparability.
Two key considerations for establishing comparability through statistical inference are:
- For the SSMQ results to be applicable to the SSM and at-scale population, the SSMQ data set must be representative of populations.
- For the SSMQ results to remain applicable during the lifetime of the product, the SSM and at-scale processes must be run consistently during the lifetime of the product, i.e., the processes must be stable.
Another consideration for statistical inference is the interpretation of multiple inferential methods that produce binary results, “equivalent” or “not-equivalent.” These methods can make one of two errors, declaring “equivalent” when truly not equivalent and declaring “not equivalent” when truly equivalent. The probabilities of making these errors are small, say 5% or 10%; however, when many tests are run, say 20 or 10, there is a chance of one or two errors. This is an important fact often overlooked by scientists and health authorities in evaluating the statistical component in a qualification report. It is also an important rationale for not using statistical methods alone to qualify or not qualify a model.
A condition often associated with many inferential procedures, e.g., t-tests, is that the data may be treated as samples from a normal distribution.2,3
Difference Tests (T-test and F-test)
Difference tests, or null hypothesis significance tests (NHSTs), are statistical procedures that test the accepted state of nature (null hypothesis) against a new or alternative state of nature (alternative hypothesis).
Two difference tests are described. The t-test is used to compare the means between scales, while the F-test is used to compare the variances between scales. Variance is the square of the standard deviation and is a measure of the spread of data. Other tests to compare variances include the Levene and Brown-Forsythe tests.
T-test:
The hypotheses for t-tests are:
Null Hypothesis: Mean of SSM = Mean of at-scale,
Alternative Hypothesis: Mean of SSM ≠ Mean of at-scale.
These hypotheses make it clear that the scientist is undertaking this procedure with the accepted state of nature being equality of means and the alternative state of nature being inequality of means.4,5
F-test
The hypotheses for the F-test are:
Null Hypothesis: Variance of SSM = Variance of at-scale,
Alternative Hypothesis: Variance of SSM ≠ Variance of at-scale.
Like the t-test, these hypotheses make it clear that the scientist is undertaking this procedure with the belief that the accepted state of nature is that the two scales are equal in variances.
The F-test is appropriate for non-satellite study designs (independent samples). It is not appropriate for satellite designs.
Difference tests are often used in SSMQ because they are well known, come with a widely accepted decision rule (reject the null hypothesis if p < 0.05), and do not require a prespecified threshold for a practically significant difference.
The drawback of the difference tests is that the outcome of equality does not conclude equivalence between scales.
Equivalence Tests
Equivalence tests, often called “Two One Sided T-tests,” or “TOST,” are the appropriate tests for obtaining evidence of equivalency.6
The TOST is best suited for a designed experiment (satellite design). For non-satellite designs it may be desirable to forgo the formal inferential procedure and compute the confidence interval as a descriptive statistic.
The equivalence margin should be set prior to data analysis or, preferably, earlier. When the equivalence margin is set before data collection, health authorities are assured that the TOST data were not used to select an equivalence margin that would guarantee an outcome of “equivalence.”
Historical data, data that will not be used in the TOST procedure, can be used to select the equivalence margin. Many options are available, e.g., θ = 3×SD, where SD is the standard deviation of historical at-scale runs.
The hypothesis for the TOSTs is:
Null Hypothesis: |Mean of SSM - Mean of at-scale| < -θ or |Mean of SSM - Mean of at-scale |> θ,
Alternative Hypothesis: -θ ≤ |Mean of SSM - Mean of at-scale |≤ θ.
Unlike the difference test setup, here the scientist is interested in rejecting the null hypothesis.
Quality Range Method
The quality range (QR) method is an inferential method that considers both the mean and the variability of the reference samples (e.g., at-scale) to establish the population ranges.
Several QRs exist, and for normal distribution assumed or tested, the general formula is:
Mean +/- k*std (for a 2-sided interval, so for low and high limits)
With mean = mean of the reference, e.g., the at-scale values and std=standard deviation of the reference, e.g., the at-scale values.
The value k varies regarding the different type of QRs; the most known QRs are sigma interval, prediction interval, and tolerance interval.
The SSMQ is claimed when all or a certain proportion of scale-down values (e.g., 90%7) are inside the QRs, and not only if the means of the at-scale and of the scale-down data are comparable.
The advantages of the QR method are that it presents visual graphical outputs with all individual values, for the reference values as well as for the test value (e.g., SSM), and that it facilitates understanding of the comparison output.
In the graph below, we can see an example of QR (±2.6 SD build on at-scale lots) for six at-scale batches and six SSM batches:
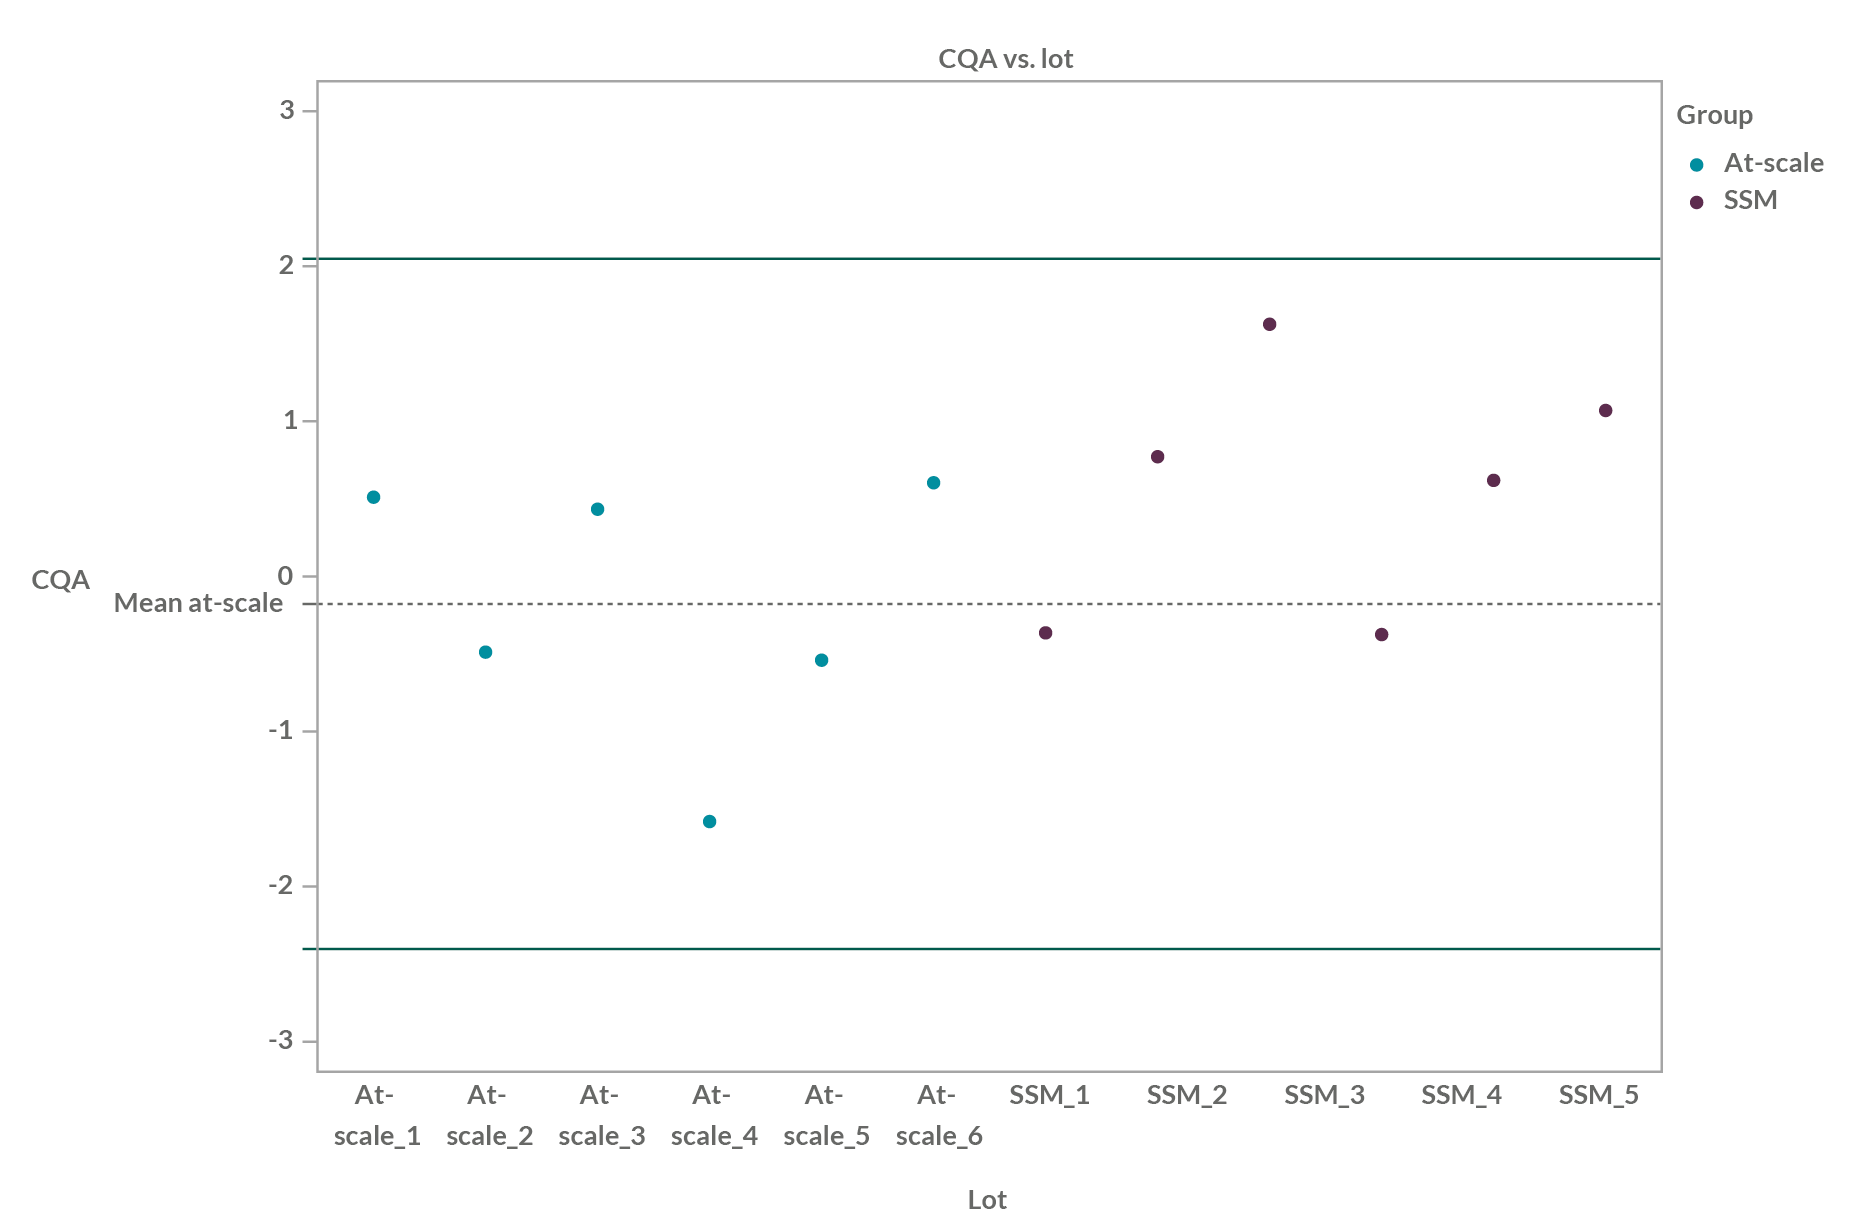
Figure 1: Quality range example of six at-scale batches and six SSM batches; QR is ±2.6 SD (99% of population within theoretical) build on at-scale lots.
The drawbacks are that these quality ranges could be too large7,8 and therefore are too lenient, particularly in some situations with small sample sizes. Some recommendations for their use, especially regarding the sample size of both at-scale and scaled-down data, are given in the white paper (see Reference 1).
Multivariate Analysis (MVA)
TOST is a statistically sound solution for equivalence testing regarding a single variable. However, it does not consider the correlation among the entire set of variables to be used for equivalence testing. MVA, in contrast, allows time-based data sets for a comprehensive set of parameters to be simultaneously included to define the cell culture process profile in terms of growth, metabolism, productivity, and product quality throughout the process duration at both scales.
MVA is a set of statistical tools (e.g., principal component analysis [PCA], partial least squares [PLS], etc.) used for the simultaneous analysis of multiple variables and can be used to compare large, complex data sets. The goal is to use MVA methods to model the correlation among the output variables of interest. With the developed MVA models, the time-based process profiles can be compared between scales for any time point throughout the process trajectory, not just the final state (final viable cell density, final product quality attributes, etc.).9
A specific MVA approach has been used to model a cell culture process to support SSMQ. This MVA approach uses dimension-reduction techniques (PCA, PLS) to model the data with a relatively small number of principal components (also known as latent variables) that are linear combinations of the variables in the original data set. This approach is discussed in the white paper (see Reference 1).
Conclusions
Small-scale models are a useful tool in biopharmaceutical process development. Design of the models requires careful choice of scaling parameters to best match large-scale outputs. Qualification of the models proves that they generate comparable performance and quality attributes, justifying their use to address regulatory expectations. Qualification is performed using statistical comparison to large-scale run data. A variety of statistical methods can be used for qualification with appropriate justification.
Acknowledgments
This manuscript was supported through the 28-company collaboration within BioPhorum Development Group (BPDG) Qualification of Small-scale Model Workstream with significant support from the Viral Clearance Workstream.
The authors also acknowledge their fellow workstream participants for their survey input and the useful discussions and contributions to the critical manuscript review.
References
- Justification of Small-scale Models: An Industry Perspective. BioPhorum Development Group, Qualification of Small-Scale Models Workstream. May 2021.
- Lumley T, Diehr P, Emerson S, Chen L. 2002. The Importance of the Normality Assumption in Large Public Health Data Sets. Annu. Rev. Public Health. 23: 151–69. https://www.annualreviews.org/doi/full/10.1146/annurev.publhealth.23.100901.140546.
- Ratcliffe JF. 1968. The Effect on the t Distribution of Non-normality in the Sampled Population. Appl. Stat. 17:42–48. https://rss.onlinelibrary.wiley.com/doi/10.2307/2985264.
- Welch, BL. 1947. The Generalization of Students Problem When Several Different Population Variances are Involved. Biometrika. 34: 28–35. https://academic.oup.com/biomet/article-abstract/34/1-2/28/210174?redirectedFrom=fulltext.
- Pinheiro JC, Bates DM. 2002. Mixed-Effect Models in S and S-PLUS. https://link.springer.com/book/10.1007/b98882.
- Schuirmann, D.J. 1987. A Comparison of the Two One-Sided Tests Procedure and the Power Approach for Assessing the Equivalence of Average Bioavailability. Journal of Pharmacokinetics and Biopharmaceutics 15:657–680. https://link.springer.com/article/10.1007/BF01068419.
- Food and Drug Administration (FDA). Development of Therapeutic Protein Biosimilars: Comparative Analytical Assessment and Other Quality-Related Considerations. Draft Guidance for Industry. May 2019 https://www.fda.gov/media/125484/download.
- EMA/CHMP/138502/2017: Reflection Paper on Statistical Methodology for the Comparative Assessment of Quality Attributes in Drug Development. European Medicines Agency, Committee for Human Medicinal Products. 23 Mar 2017. https://www.ema.europa.eu/en/documents/scientific-guideline/draft-reflection-paper-statistical-methodology-comparative-assessment-quality-attributes-drug_en.pdf.
- Tsang VL, Wang AX, Yusuf-Makagiansar H, Ryll T. 2014. Development of Scale Down Cell Culture Model Using Multivariate Analysis as a Qualification Tool. Biotechnol. Prog. 30:152-160. https://aiche.onlinelibrary.wiley.com/doi/10.1002/btpr.1819.