
System Failure Mode & Effects Analysis (SFMEA): An Alternative Approach For Analyzing Risks
By Mark F. Witcher, Ph.D., biopharma operations subject matter expert

FMEA (failure mode and effects analysis) is one of the most common methods for analyzing risks.1 FMEA is generally regarded as difficult to use and challenging for communicating the results of the analysis internally, externally, or to management and regulatory agencies. Because some companies are required by internal procedures to use risk matrices and FMEA for prioritizing and analyzing risks, this article describes an alternative approach based on relational risk analysis (ReRA) for conducting a system failure mode & effects analysis (SFMEA)2. SFMEA is an easy to use, intuitively obvious method of identifying, analyzing, understanding, evaluating, managing, and communicating a wide variety of risks.
If risks are defined as “the impact of uncertainty on a mechanism, process, or system that achieves an objective,” then FMEA can be adapted to the revised definition for analyzing the impact of failure modes on the risk’s mechanism, process, or system as shown in Figure 1. ReRA defines a risk as a relationship using a system risk structure (SRS) between a cause event that might pass through one or more systems resulting in an effect event. The risk’s cause can be either a threat or opportunity that produces either a harm or a benefit. The primary determinant of the success or failure of controlling the risk is whether the system propagates the cause to produce the effect.
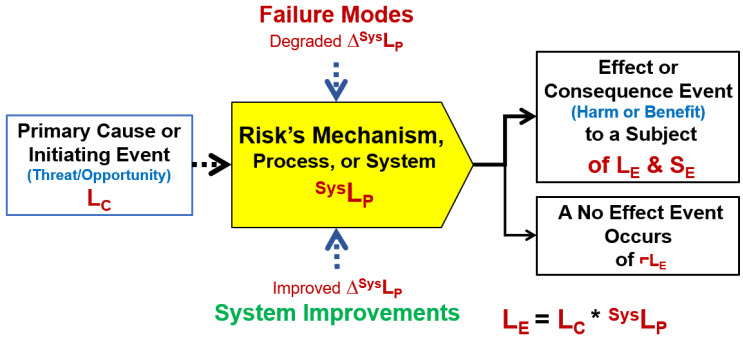
Figure 1: Basic system risk structure (SRS) element for a ReRA risk. The relationship describes the probability of the effect or consequence event occurring LE as the mathematical product of the cause or initiating event’s probability of occurring LC and the probability SysLP of the system propagating the cause to produce the effect. If the effect event does not occur, then a no-effect event with a probability of ⌐LE = 1 – LE occurs.
All risks can be described as a sequence of events and systems that begins with an initiating cause event that might move through a sequence of one or more systems to produce a final effect or consequence event impacting the risk’s subject. Achieving the effect event of either producing a gain or preventing a loss can be considered the subject’s objective. The primary ramification of defining a risk as a relationship that includes a system is that the risk contains two subjects that can be impacted by events or situations. The first subject is the person, enterprise, or entity impacted by the effect event. The second subject is the risk’s system, because it can be impacted by a variety of secondary factors described as either failure modes or system improvements. The secondary factors impact the probability of the system propagating the cause to produce the effect. However, risks must be modeled to describe two different outcomes. One type of risk is to prevent harm while the other is to achieve a benefit. Thus, a “risk” is either a failure to prevent a harmful event or the failure to achieve a beneficial event.
Before describing how the two types of risks are analyzed and managed, a simple method of characterizing risk events is required.
A Risk Event’s Significance
The most obvious attribute of a risk event is the significance of the effect or objective event on the subject. For a harm risk, it is the severity of the subject’s loss. While risk events have a wide variety of impacts, some highly subjective, every consequence event can be evaluated according to its monetary impact. A risk’s impact, either positive or negative, can be measured using the three scales shown in Table 1.
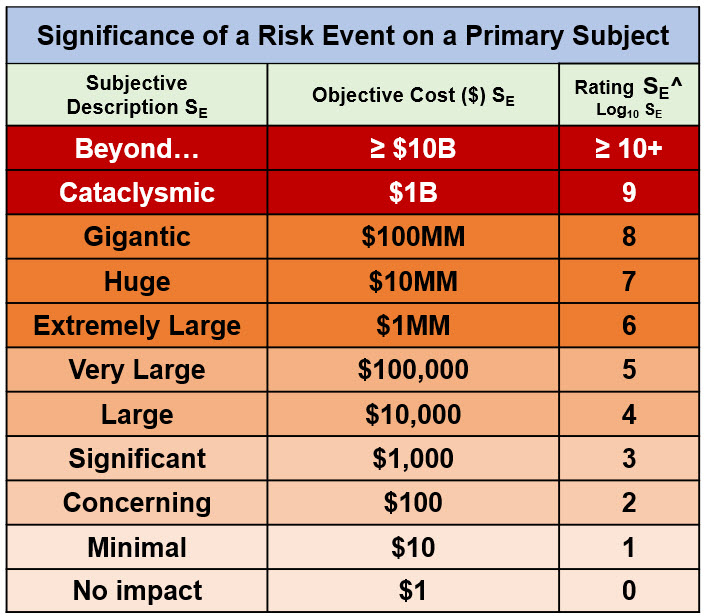
Table 1: A risk event’s significance rating table. The significance rating is based on US$. For a harm risk, SE represents the loss. For a benefit risk, SE can represent either the value of achieving the objective or the cost of not achieving the benefit. The significance rating SE^ is calculated as the Log10 (SE in dollars).
The monetary value of a risk event can be determined by the value of the gain or loss in terms of the potential value of the objective actual costs lost or spent or avoided costs not incurred. A monetary scale provides an important basis for evaluating a risk’s consequence event for several reasons. The monetary value of the event can be used to evaluate or compare the cost of remediation should it occur or the cost of investment options for modifying its probability of occurrence as an improvement opportunity.
The second attribute of any risk event is the probability that it will occur.
A Risk’s Probabilities
Using ReRA, a risk has two probabilities. The first is the probability of an event occurring and the second is the probability of the risk’s system propagating the cause event to produce the effect event. A universal probability scale to describe both harm and benefit risks is shown in Table 2.
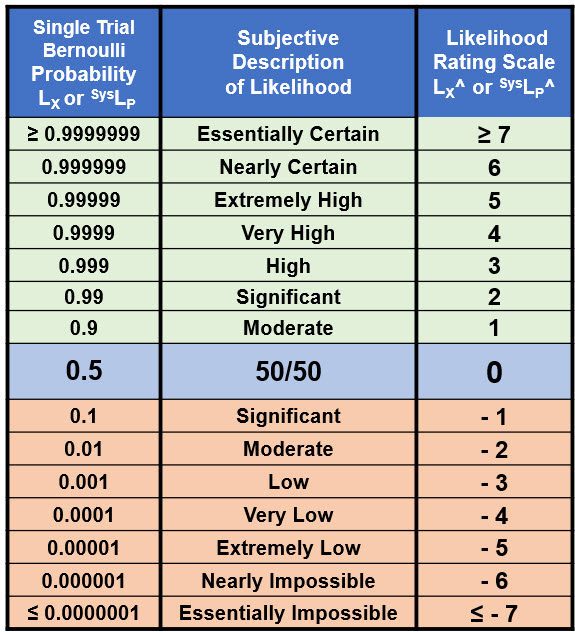
Table 2: Probabilities for both the risk event’s occurrence and the risk’s system that propagates the cause to produce the effect. The table includes probabilities LX on the left and probability ratings LX^ on the right. The universal table can be used to describe probabilities of both harm and benefit risk events and the probabilities of an event occurring or not occurring.
Table 2 spans the probabilities LX for a single trial Bernoulli probability distribution from essentially certain (0.9999999) to essentially impossible (0.0000001). The likelihood rating scale LX^ is a device that can be used to very simply describe and manipulate probabilities for both harm and benefit risks. The rating table is created as follows:
- for probabilities < 50%, the rating is calculated as the Log10 of the probability;
- for a probability of 50%, the rating is zero; and
- for probabilities > 50%, the probabilistic relationship LX + ⌐LX = 1 creates the relationship ⌐LX^ (> 50%) = – LX^ (< 50%) to complete the table.
The rating values from 7 to -7 span the useful range of probabilities and can be extended in either direction as needed. The top half of Table 2 usually represents a success rate while the bottom half represents a failure rate. For example, a failure rate for event X of LX^ = -2 (1%) corresponds to a success rate of ⌐LX^ = 2 (99%) and vice versa. The symmetry around 50% is a useful feature for translating a success rate into a failure rate for evaluating compound risk sequences that are modeled as a combination of benefit and harm risk system sequences. Thus, a system that is evaluated as a benefit risk can be incorporated into a failure risk sequence using the relationship ⌐LX^ = – LX^.
Given the high intrinsic uncertainties of most risks, order-of-magnitude (OoM) estimates for a risk event’s severity and probabilities are usually sufficient for accepting, rejecting, and managing most risks. While a risk analysis team, including regulatory agencies, might argue or disagree about a probability estimate, at least they are arguing using the same attribute scale.
Since both rating attributes are defined in terms of universal values, the OoM significance and probability tables can be used to provide a universal rating matrix for comparing and prioritizing different risk events.
A Risk Matrix
Although risk matrices are not recommended by the author, they are prevalent in many industries and often required by company procedures. Table 3 represents an option for including a risk matrix for describing the relative priority or significance of risk events based on a metric similar to a risk priority number (RPN) that combines a risk event’s significance and likelihood of occurrence.
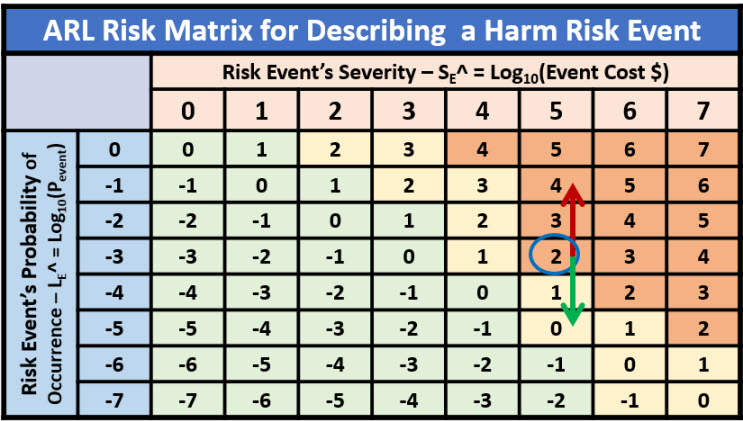
Table 3: A risk matrix describing the relative significance of one or more risk events. The red arrow represents the impact of a failure mode and the green arrow represents the impact of an improvement opportunity. The color coding represents the risk appetite of the analysis team.
If a defined risk is modeled to have a fixed severity, then the priority of the risk is modified by changing the probability of the risk event’s occurrence. Risks with different significance should be modeled as different risks.
An alternative rating system is the adjusted risk likelihood (ARL) as shown in Figure 2.
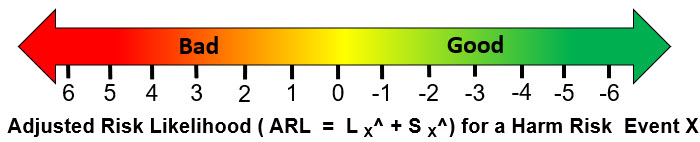
Figure 2: A scale describing the ARL of a harm risk event calculated as the sum of LE^ and SE^. Similar scales can be constructed to describe benefit risk events.
The ARL provides a very quick measure for communicating a risk’s priority with a positive number, meaning the significance rating is larger than the probability of occurrence rating.
Analyzing, Managing, And Communicating Risks
With the risk event’s attributes described by ratings, the risk relationship in Figure 1 can be redefined in terms of severity and probability ratings as shown in Figure 3.
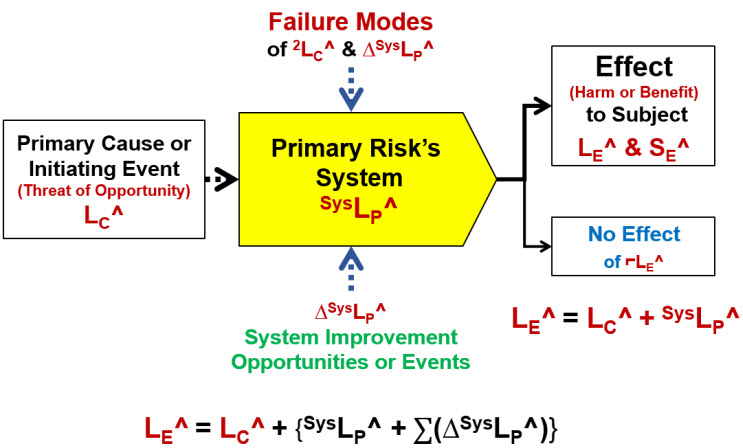
Figure 3: The SRS describing the risk relationship using probability ratings defined in Tables 1 and 2. Secondary factors would include both failure modes and improvement opportunities and events. Each failure mode is a risk event that has a potential impact severity on the risk’s system of ΔSysLP^ and likelihood of occurrence of 2LC^. System improvement opportunities are either changes to how the primary risk’s system functions or an event with both an impact significance ΔSysLP^ and probability of occurrence 2LC^. A potential improvement event could be the detection of the primary cause’s occurrence by the system.
In the case of harm risks, failure modes make the system more likely to propagate the cause event, while, for benefit risks, a failure mode decreases the probability of the system propagating the initiating event. Improvement opportunities have the opposite impact, making harm risk systems more likely to block a threat to prevent harm while making a benefit risk system more likely to propagate an opportunity into a benefit. Improvement opportunities can be either an external event that improves the system or a change in how the system works to improve the system’s performance.
The inclusion of the “no effect” event in the SRS can be very important. In some risk sequences, a no effect event can branch the risk sequence toward other risk sequences and subjects that may have more impact than the initial sequence for the initial subject. For example, not detecting contaminated product during manufacturing or release testing is a product risk analysis that can potentially have a much greater impact because it initiates a risk sequence where the final subject is the patients using the product. However, if the patient is the final subject, then all the systems between the product and the patients must be included in the risk analysis.3
The details of the risk shown in Figure 3 can be summarized using a risk register (RR) template as shown in Table 4.
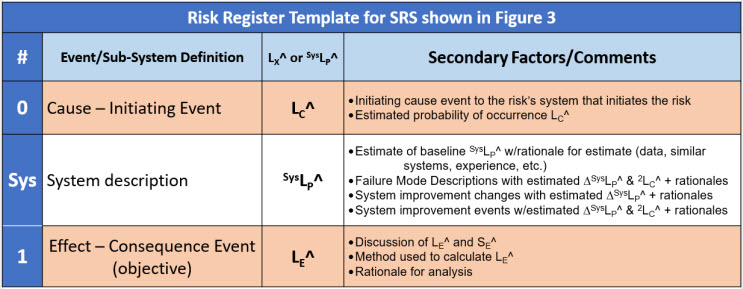
Table 4: Risk register (RR) template for describing the single system SRS shown in Figure 3. The probability of the effect event is equal to the sum of LC^ and SysLP^. Significant secondary cause events to a primary risk system may require a separate risk register. By convention, events are numbered and systems are lettered.
The basic elements of an SFEMA can be communicated using the SRS and an RR. As mentioned earlier, the intrinsic nature of risks requires treating a risk as either a harm or benefit risk.
Analyzing Harm And Benefit Risks
A harm risk prevents a harm event from occurring by having a system with a very low probability SysLP^ of propagating a threat event into a harm event. On the other hand, a benefit risk should have a system designed to have a very high probability of propagating an opportunity event to produce or achieve a benefit event. Using the mathematics of probabilities, the overall SysLP of the risk’s system for both harm and benefit risks is the mathematical product of all the XLPs of the system sequence.
Harm risks typically require a sequence of systems that combine to have a low probability, usually much less than 50%, of propagating the initial threat to produce a bad consequence. Harm risk systems can be visualized as Reason’s classic layers of cheese that collectively block the flow of a threat event to produce a harm event.4 Examples of harm risks include assuring personal safety and product cross-contamination.
Using the model in Figure 3 and keeping in mind that for probabilities less than 50% the ratings are Log10 of the probabilities, the product of the probabilities is the sum of the logarithmic ratings. Since the systems form protective layers where the overall probability SysLP is calculated as the mathematical product of the sequence’s probabilities, the overall probability rating SysLP^ is calculated as the sum of the individual system XLP^ ratings.
However, for benefit risks, the sequence of systems can be visualized as a chain with an overall probability of success such that if one link fails, the whole chain fails. The higher the probability of every link holding, the stronger the chain. Thus, evaluating SysLP^ requires carefully evaluating the systems to identify those with the lowest XLP^ probability of success. Therefore, for a sequence of benefit systems with most links having a high probability of success, the probability of the chain SysLP^ can be approximated as the minimum value of the XLP^’s in the risk’s chain of systems.5,6
For both harm and benefit risks, the systems are subject to a variety of secondary factors that can strengthen or weaken each system’s XLP^ performance. These secondary factors can be both failure modes and opportunities for improving the various risk systems.
Describing And Managing Failure Modes
Failure modes are secondary input cause events that occur to a risk’s system. Because they are events, they too can be described as risk relationships using the relationship shown in Figure 3, with the exception that the severity of a secondary risk is the amount it changes the SysLP^ of the system it targets. The secondary risk events occur with a likelihood of 2LC^ as shown in Figure 3. Because secondary risks can have their own secondary risks, very complex risk structures can have two or more layers of nested secondary risks defining a network of failure modes associated with structuring a multilayer complex risk.
To illustrate the use of SFMEA and demonstrate both a harm and a benefit risk, the following two examples are presented.
Example Of Harm Risk: Preventing Contamination
A good example of a harm risk is preventing a contaminant source from contaminating a product or in-process material during a manufacturing operation. Figure 4 shows a four-system SRS that prevents contaminants from people reaching a product being processed in a cleanroom inside a laminar flow hood in an open container.
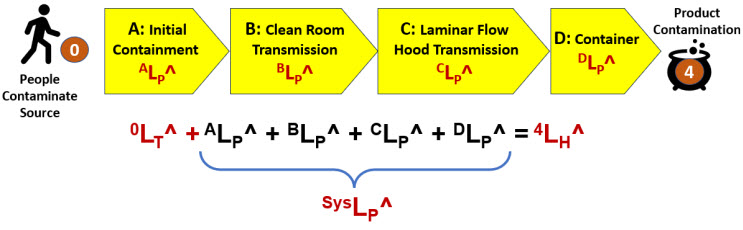
Figure 4: A four-system SRS describing the harm risk of product contamination from personnel. The contamination threat has an LT^ rating of 0 (certain). The four harm systems describe the path by which the contaminant would move from the operator to the product.
The four systems are:
- Initial Containment: The personnel are gowned up in cleanroom garments donned in an airlock.
- Cleanroom: The gowned personnel enter a HEPA filtered cleanroom. The HEPA filters clean the air, removing most of the contaminants emitted by the people.
- Laminar Flow Hood (LFH): LFH uses unidirectional flow of HEPA filtered air, directing any airborne contamination away from the product container.
- Container: An open container contains the product or in-process material. In this example, the container is assumed to provide no protection; therefore, DLP^ = 0.
The summary risk register for the SRS in Figure 4 is Table 5.
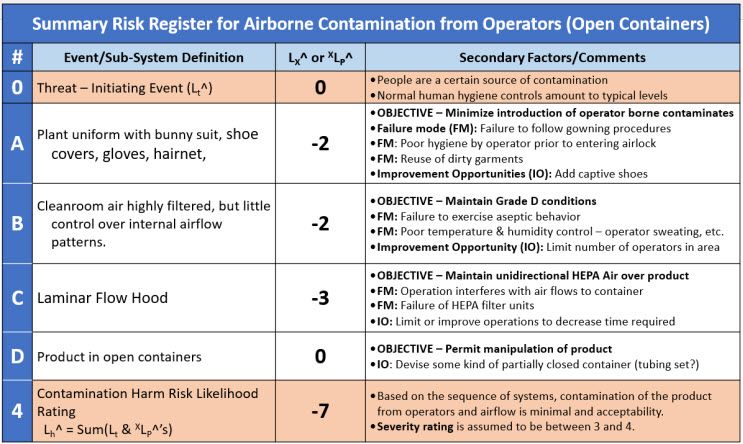
Table 5: A brief summary risk register for the contamination harm risk SRS in Figure 4. The probability of the final event is calculated as the sum of the individual systems. The RR does not include quantification of either 2LC^ or ΔXLP^ failure modes.
The risk register summarizes the results of the team’s risk analysis. Given the team’s assumptions and the estimated performance of the four systems, the likelihood of contamination 4LH^ = -7 or essentially impossible unless one or more failure modes occur.
However, each system should be examined for vulnerabilities that might increase the likelihood of contamination passing through the system. For example, the effectiveness of gowning in System A can be compromised by using poor garments or poor donning methods by the operator. System B might be compromised by poor operator behavior or inadequate airflows within the cleanroom. System C could be impacted by poor manipulation techniques by the operator or improper maintenance of the LHF’s HEPA filtration systems. In addition, opportunities for improving the probability of success of each protective layer can be identified and reviewed for implementation by the risk analysis team.
The second example demonstrates the analysis of a benefit risk associated with making media.
Example Of Benefit Risk: Procedure for Making Media
The procedure for making media can be summarized in six systems as shown in the SRS in Figure 5. For illustration purposes, a seventh system (E2) is added to describe a secondary system required for controlling an important failure mode associated with the sterilization process system E. If the analysis team deems it appropriate, secondary risk systems can be added to any primary system to control failure modes.
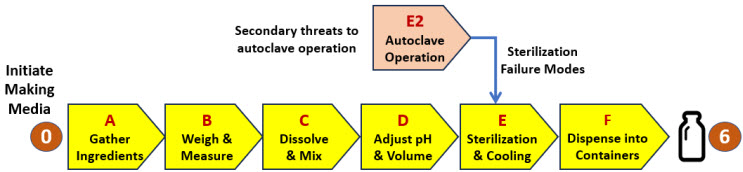
Figure 5: SRS for a procedure to make media. If any of the six steps (A through F) fail, the media will not be successfully manufactured. The RR for the primary risk is shown in Table 6. The SRS is supplemented with a secondary risk associated with the operation of an autoclave to sterilize the media. The autoclave risk is treated as a harm risk with the failure rate converted to a benefit risk rating. A supplemental RR for system E2 is shown in Table 7.
The SRS in Figure 5 is summarized in the risk register shown in Table 6.
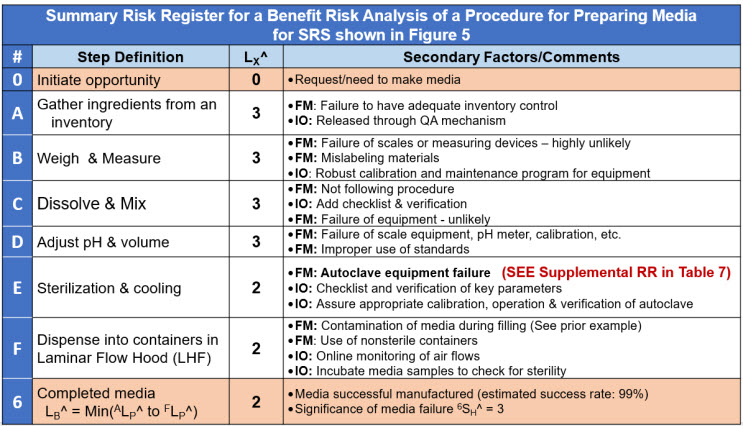
Table 6: A very brief risk register for the benefit risk shown in Figure 5 of a procedure to make media. System E has a supplemental RR for a primary failure mode. The RR does not include quantification of either 2LC^ or ΔXLP^ failure modes.
Both failure modes and improvement opportunities are risk relationships. They can be analyzed individually or as part of a larger risk analysis when they significantly impact a larger primary risk. An example secondary risk associated with a primary failure mode of the sterilization step is described by a supplemental risk register shown in Table 7.
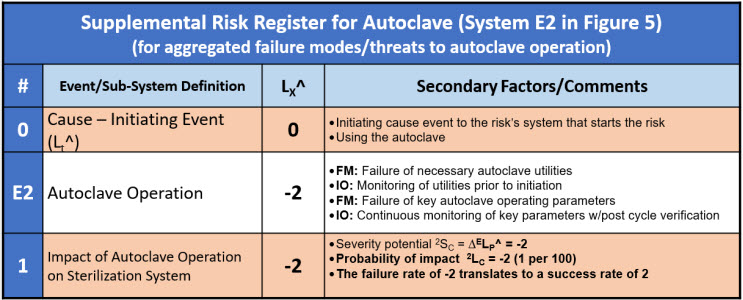
Table 7: A supplemental risk register for the secondary risk to the sterilization system of the autoclave failing shown in Figure 5. The autoclave (system E2) is evaluated as a harm risk with a failure rate of -2 taken to the primary RR as a success rate of 2.
The ReRA shown in Figure 5 and Table 6 can be expanded to include all the relevant detail required to fully understand the systems and their failure modes. In addition, improvement opportunities can be identified and used to improve the likelihood of successfully achieving the risk’s final objective.
Executing An SFMEA
SFMEA is designed to be easy to implement using a few simple steps by individuals or small teams to get a quick understanding of a risk. If the initial analysis warrants, a larger interdisciplinary team can perform a more detailed analysis.
The following is intended to summarize the method. Many other options or sequences are possible depending on the risk analysis team’s preferences.
- Identify the Risk – Identify the risk’s three elements: initiating cause event, system sequence, and consequence effect event. A cause event may produce more than one effect event, and an effect event may be caused by several events. A risk analysis can be started by identifying a system and then identifying the risk’s input cause events and output effect events. Each cause-system-effect relationship is a different risk and should be analyzed as such. Commingling risks is a primary source of confusion.
- Build an SRS for the risk by breaking the system sequence into definable subsystems with important intermediate events identified.
- Draft a RR – Prepare a risk register template that describes the SRS event and system sequence. Some intermediate events could represent important control points for evaluating and controlling the overall risk.
- Evaluate the failure modes – For each system, identify the failure modes that could degrade their performance. If significant failure modes are identified, prepare a supplemental RR for each major sub-risk.
- Identify opportunities for improvement – For each system, identify what could be done to improve the probabilistic performance of the system. In some cases, a secondary system can be added or modified to manage the probability of assuring that the beneficial events occur.
- Estimate probabilities – Estimate the probability of the initiating event. For most benefit risks, the initiating event is certain because they are initiated intentionally. Estimate the baseline XLP^ for each system. For each significant failure mode for each system, estimate the ΔXLP^ and 2XLC^. In many cases, the estimates can be based on experience with similar systems. In other cases, data may be available to estimate the success frequencies or failure rates.
- Document the analysis – Complete the RR and reach a consensus on the estimates and rationales for the significance and probability estimates. Disagreements should be discussed and documented. The team should either accept or reject the risk. If rejected, manage the risk to an acceptable probability. The risk can be managed by changing or adding additional systems to the SRS to make the probability of the final consequence acceptable.
If the result of the risk analysis is to reject the risk as formulated, then the overall probability of achieving the objective can be improved by modifying the existing systems, controlling failure modes, or identifying and implementing improvement opportunities. In some cases, additional risk systems can be added to the risk sequence to improve the overall probability of the sequence.
Final Word
Both relational risk analysis (ReRA) and SFMEA are in their early stages of development. Both can be modified as needed by the analysis team to improve their effectiveness for analyzing and understanding risks. Any suggestions and comments are most welcome and encouraged. Please provide suggestions to the author via LinkedIn.
References
- Carlson, C.S., Effective FMEAs: Achieving Safe, Reliable, and Economical Products and Processes using Failure Mode and Effects Analysis, Wiley, 2014.
- Witcher, M.F., Relational Risk Analysis For The Bio/Pharma Industry, BioProcess Online, January 29, 2024. https://www.bioprocessonline.com/doc/relational-risk-analysis-for-the-bio-pharma-industry-0001
- Witcher, M.F., Using System Risk Structures To Evaluate COVID-19 Pandemic Risks” BioProcess Online, December 2021. https://www.bioprocessonline.com/doc/using-system-risk-structures-to-evaluate-covid-pandemic-risks-0001
- Reason, J., Managing the Risks of Organizational Accidents, Ashgate, 1997,
- Witcher, M.F., Using Relational Risk Analysis To Control Procedure Failures, February 15, 2024. https://www.bioprocessonline.com/doc/using-relational-risk-analysis-to-control-procedure-failures-in-the-bio-pharma-medical-device-industry-0001
- Witcher, M.F., Managing Supply Chain Risks Using Relational Risk Analysis, April 5, 2024. https://www.bioprocessonline.com/doc/managing-supply chain-risks-using-relational-risk-analysis-0001
About The Author:
 Mark F. Witcher, Ph.D., has over 35 years of experience in biopharmaceuticals. He currently consults with a few select companies. Previously, he worked for several engineering companies on feasibility and conceptual design studies for advanced biopharmaceutical manufacturing facilities. Witcher was an independent consultant in the biopharmaceutical industry for 15 years on operational issues related to: product and process development, strategic business development, clinical and commercial manufacturing, tech transfer, and facility design. He also taught courses on process validation for ISPE. He was previously the SVP of manufacturing operations for Covance Biotechnology Services, where he was responsible for the design, construction, start-up, and operation of their $50-million contract manufacturing facility. Prior to joining Covance, Witcher was VP of manufacturing at Amgen. You can reach him at witchermf@aol.com or on LinkedIn (linkedin.com/in/mark-witcher).