
A Swab Limit-Derived Scale For Assessing The Detectability Of Total Organic Carbon Analysis
By Andrew Walsh; Thomas Altmann; Alfredo Canhoto, Ph.D.; Ester Lovsin Barle, Ph.D.; David G. Dolan, Ph.D.; Andreas Flueckiger, M.D.; Igor Gorsky; Robert Kowal; Mariann Neverovitch; Mohammad Ovais; Osamu Shirokizawa; and Kelly Waldron
 Part of the Cleaning Validation for the 21st Century series
This article will discuss how the detection limit for analytical methods can be combined with cleaning validation swab limits to create a detectability scale similar to that described in our article on visual inspection.1 This new detectability scale can assist in determining whether an analytical method is acceptable for use in a cleaning validation or verification. Combined with the HBEL-derived toxicity scale2 and Cpu (process capability)-derived probability scale,3 it can also provide for a total measure of risk in cleaning.
Note: This article uses the term health-based exposure limit (HBEL), which is synonymous with the terms acceptable daily exposure (ADE) and permitted daily exposure (PDE).
Selection Of Analytical Methods In Cleaning
Analytical methods typically used in cleaning validation fall into the two broad categories of specific methods and nonspecific methods, and the decision for using one or the other should be science-based and risk-based.1 Figure 1 presents a hierarchy for selecting analytical methods in reference to the HBEL-derived toxicity scale.2 For low-risk situations, visual inspection may be the only method needed, supported by nonspecific methods or by specific methods as necessitated by the increasing hazard level. As the level of the hazard increases, the rigor required of the analytical method should also increase. However, as indicated by the question marks, the transitions from using only a visual inspection to needing a nonspecific analysis such as total organic carbon (TOC) and then to needing a specific analysis are not obvious. The use of the scale discussed in this article may provide a tool to help resolve these questions for analytical methods as was shown for visual inspection.1 This article is focused on TOC as an example for nonspecific methods, as compounds containing organic carbon are the most common; however, this scale could be applied to other analytical methods.
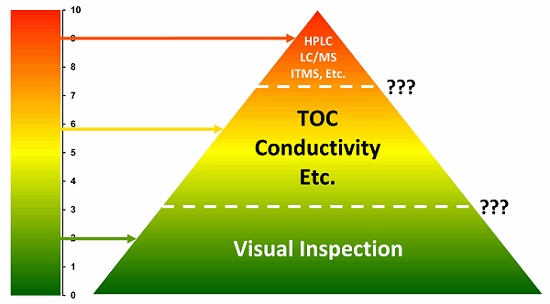
Figure 1 - Risk hierarchy of analytical methods (Note: Toxicity scale is based on –log(HBEL) where HBEL is the acceptable daily exposure in grams)
Determination Of Analytical Detection Limits
Detection limits (DLs) and how they are determined are fundamental to this discussion. It is fairly well known that DLs for HPLC are normally determined by evaluating the signal-to-noise ratio. As stated in ICH Q2(R1):4
"Determination of the signal-to-noise ratio is performed by comparing measured signals from samples with known low concentrations of analyte with those of blank samples and establishing the minimum concentration at which the analyte can be reliably detected. A signal-to-noise ratio between 3 or 2:1 is generally considered acceptable for estimating the detection limit."
For methods where there is no specific background noise to measure, such as TOC, other techniques may be employed, such as the standard deviation of the blank. ICH Q2 states:
Measurement of the magnitude of analytical background response is performed by analyzing an appropriate number of blank samples and calculating the standard deviation of these responses.
Similarly, a multiple of 3 is applied to the standard deviation of the blank and set as the DL. For example, for a blank with a mean of 100 and a standard deviation of 30, the DL would be set at 190 (100 + 30 x 3 = 190). This type of approach has been used for TOC.
Detection Limits For TOC
Acceptance of TOC for use in cleaning validation has grown over the past 20 years, with a number of articles being published on its application to APIs and cleaning agents.5-19 Of the 15 articles cited, only eight addressed the DL for TOC in one way or another. Since the methods for calculating DLs are a matter of debate among analytical chemists,20 this may account for the lack of information on DLs for TOC in past articles. However, for the purposes of this article, the DL of TOC is very important.
An early article on using TOC for cleaning validation by R. Baffi, et. al.5 examined its use for biologic compounds. The authors mention in their abstract that "...a limit of detection of approximately 0.1 ppm," but the text offered no details on how this DL was derived.
Gavlik, et. al. in 19956 published an article on the potential use of TOC for cleaning agents, but focused on recovery and did not report any other method parameters.
In 1996, Jenkins, et. al.7 published a comprehensive review of swab and rinse recoveries for a variety of swab and filter materials and briefly discussed the DL. In their article, DL was defined as "...the absolute value of the intercept plus three times the estimated standard deviation." The authors reported DLs that ranged from 1 ppm to 14 ppm.
Strege, et. al. in 19968 discussed the DL and stated, "A limit of detection and limit of quantitation were established at 9.2 µg/swab and 12.1 µg/swab." The authors did not provide details on how the DL was arrived at but wrote that "...a set of 10 swab blanks were prepared and analyzed." Data or calculations for the DL were not provided, but the authors included a glossary from the USP XXII that mentioned "...analyzing a number of blank samples and calculating the standard deviation of this response. The standard deviation multiplied by a factor, usually 3, provides an estimate of the limit of detection." Since the rest of this article will present DLs in ppb (parts per billion), these results need to be converted. Based on their description of the handling of other swab samples, it appears that the swab dilution volume was 5 mL, and this would translate to a DL of 1,840 ppb (9.2 µg/5 mL = 1.84 µg/mL = 1,840 ppb).
Holmes, Alison J. and A. J. Vanderwielen in 19979 reported using TOC for analysis of aspirin residues on several materials of construction and reported DLs of 3 to 15 ppm. These investigators included swabbing an unspiked coupon surface as part of the swab blank, which other investigators have not mentioned.
Guazzaroni, et. al. in 199810 discussed the use of TOC for a number of compounds (cleaning agents, endotoxin, biologic media, and PEG) and reported the DL as 50 ppb "…as per the manufacturer's specification," but stated that the TOC background, including the swab and filter material, was about 2.5 ppm.
Kirsch in 199811 discussed the parameters important to the validation of methods used for cleaning and mentioned the applicability of TOC. Kirsch stated that the DL is "… most practically defined as approximately three times the standard deviation of the baseline noise level around the analyte peak." While this is applicable to HPLC and some TOC analyzers, it is not applicable to all TOC analyzers.
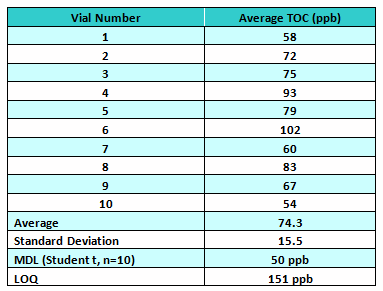
In 2000, Karen Clark12 analyzed "swab blanks" as a means to calculate a DL for TOC.5 In her study, a swab blank is defined as a vial containing low TOC water (<25 ppb) along with the head of one swab. Four replicate analyses were performed on each swab blank and the mean and standard deviation were calculated. Using a Student t-test analysis of 10 swab blanks, Clark found the DL for TOC to be 50 ppb.
Table 1 - Calculated TOC Averages from 10 Blank Vials12
In 2004, Wallace, et. al. of Teledyne Instruments13 published a brief review of some factors to consider for implementing TOC, such as detergent selection and acceptance criteria, and discussed the choice of TOC technologies, but did not discuss analytical method parameters. They did provide a table comparing the two major technologies used to oxidize the carbon in the sample to CO2: high temperature combustion (HTC) and UV/persulfate (UV/P). This table contained data on the reagent water used as a blank. From this data we can determine that the DL for HTC in this study is 51 ppb (12 ppb + 13 ppb x 3) and UV/P is 10 ppb (7 ppb + 1 ppb x 3). Both of these values are lower than they should be, as these were not "swab blanks" and did not contain any swab material. It is well known that swab material can contribute significant carbon background to the swab blank.
In 2006, Chris Glover14 performed a study of TOC using albumin and included the DL. Glover used a different approach by evaluating the accuracy data. The DL was designated as the lowest albumin weight with acceptable accuracy results (no less than 50 percent recovery). Glover set the DL at 49 ppb, but the water blank was subtracted from this value. Glover provided a table containing the raw data for 15 swab blanks. From this data, a DL can be calculated as above to be 237 ppb (186 ppb + 17 ppb x 3).
Nieves and Strege15 reported a study of the development of a test method for polysorbate 20, which was being used as a cleaning agent for vial closures. These authors used the ICH Q2 3sigma/slope approach for calculating the DL. Their calculation yielded a DL value of 660 ppb for this study.
In their article on using TOC for cleaning validation of nutraceuticals, Frey, et. al.16 mentioned the importance of method parameters including DLs, but did not provide any values obtained.
Bader, et. al.,17 in their study of the use of online TOC, state that the instruments examined met the "instrumental limit of detection of 50 ppb TOC required by USP," but did not state how that was determined or what the actual results were.
In 2012 Clifford and Tanaka18 published a study on six water soluble and water-insoluble compounds and compared the results for recovery by rinse sampling, swab sampling with a water extraction, and swab sampling using direct combustion. No analytical method parameters were discussed other than recovery.
Most recently, Xue Li, et. al.,19 in a study on cleaning agents, reported a QL of 114 ppb based on the linearity data and defined the DL as QL/3, or 38 ppb.
Table 2 summarizes the DLs reported in the literature or calculated from the data provided in the articles.
Table 2 - DLs Reported or Calculated from the Literature

While there were significant differences in the methods used to determine the DLs in these articles, it is more important to note the wide disparity in the DL values reported/calculated, which range over three orders of magnitude. As described in the visual inspection article,1 if the DL of TOC is known, then it can be compared to the TOC limit for a compound to justify the use of TOC for that compound. It should be immediately obvious that the higher the DL of TOC, the harder it will be to justify its use for compounds with lower limits. Clearly, obtaining a low DL is a very important task for the analyst developing the method, and this is something that the analyst should be aware of and address during the TOC method development.
Impact Of 1/1,000th Dose And 10 ppm Limits On The Use Of TOC
As described in the visual inspection article,1 to demonstrate the undesirable impact that retaining the 1/1,000th or 10 ppm limits would have on the use of TOC, swab limits were calculated for 304 drug compounds based on their HBELs and their corresponding 1/1,000th or 10 ppm limits21 using the assumptions in Table 3.
Table 3 - Parameter Assumptions for TOC Limit Calculations

The data obtained was plotted using R statistical software on a log scale in order to visualize it all on one graph (Figure 2).

Figure 2: Comparison of HBEL, 1/1,000th and 10 ppm to TOC Detection Limits (100 ppb)
A line has been drawn in Figure 2 at a 100-ppb level (0.1 pbm) as the TOC DL for an example. Many of these compounds cannot be considered for evaluation by TOC as the TOC swab limits based on the 1/1,000th or 10 ppm are below this 100 ppb DL or too close to it to be justified as a safe method of analysis. If some of the DLs in Table 2 were shown, even fewer compounds could be justified.
However, if only the HBELs are used to calculate the TOC swab limits, many of these compounds could easily be considered for evaluation by TOC (Figure 3). It would seem that the compounds on the right side of the curve in the rectangle could easily be justified for evaluation by TOC. But as we move to the left and the TOC swab limits get closer and closer to the 100 ppb DL it would seem harder to justify using TOC. To appropriately evaluate the acceptable use of TOC, it would be helpful to have some way of judging how close the TOC swab limit is to the TOC detection limit.

Figure 3: Drugs where HBEL can meet TOC detection limits (100 ppb)
Using The Detection Limit Of TOC As A Measure Of Detectability
In the same way as with visual inspection, we are trying to measure how close the TOC swab limit is to the detection limit of TOC so we can make a decision on whether we can use TOC. Again, a simple method to measure the relative distance is to look at the ratio of the two values. If we then take the log of this ratio we can obtain a logarithmic scale that equals zero when the values of the TOC swab limit and detection limit of TOC are equal and becomes negative when the detection limit of TOC is lower than the TOC swab limit and becomes positive when it is higher. This calculation can provide us with a carbon detection index that can be applied in all manufacturing cleaning situations (Equation 1).

where:
CDI = Carbon Detection Index
DLTOC = TOC Detection Limit
SLTOC = TOC Swab Limit
TOC detection limits can also be converted into a scale by simply taking the logarithm of the ratio of TOC detection limit to the TOC swab limit as derived as described above in Equation 1 (Table 4).
Table 4 - Detection Limit-based Scales for Detectability of Residues by TOC

In this example, any CDIs above zero are unacceptable and CDIs below -1.0 are acceptable. As can be seen comparing the three columns, as the DL increases, fewer and fewer swab limits can be met. Each company can select how close to a CDI of zero it is comfortable with. For example, one company may require its CDIs to be < -2.0, or at least 2 logarithms below the zero point.
Discussion
As stated in the article on visual inspection,3 the selection of methods for assessing cleaning should be science-based and risk-based. Key considerations for the risk assessment may include the hazard or risk of the process residue to be analyzed (toxicity score), level of detection required, applicability of existing methods, other quality and compliance risks, as well as risks to the business such as difficulty of implementation and the possible long-term maintenance of the method for ongoing monitoring programs. A reasoned and logical approach needs to be taken, as some methods may be unnecessarily expensive or difficult to implement for the process residues under consideration. Conversely, a simple inexpensive method may not be appropriate for all process residues. In general, the simplest techniques should be examined first and used if determined to be appropriate through an assessment based on science and risk. Ultimately, the goal should be to use the simplest technique that is appropriate and can be justified. TOC has proved to be one of the easiest analytical methods to implement, and is becoming a method of choice, for cleaning validation.
The scale reveals the two aspects of method development for cleaning that work in concert with each other. One is the HBEL, which drives the swab or rinse limits, which must be determined judiciously. Undue conservatism in calculating the HBEL through the excessive application of adjustment factors can easily result in swab or rinse limits that are so low as to be unachievable, which is in conflict with the longstanding guidance on cleaning from the FDA that limits should be "practical, achievable and verifiable."22 This can lead to excessive cleaning efforts or unnecessary dedication, which conflicts with not only business goals but the intended purposes of Risk-MaPP.23 The second aspect, the method DL, decides whether the method can be used based on the first aspect. Inattention to the DL when developing a TOC method can lead to high DLs (see Table 2) and result in TOC being restricted from use with many compounds. Conversely, lower DLs would allow the TOC method to be used more widely. If the TOC limits are set too low using arbitrary or non-health-based limits (as discussed above), then, again, TOC could not be justified. Regulators should ask to see scientifically justified swab limits (i.e., based on the HBEL), along with the corresponding DL when TOC or any other analytical methods are used for cleaning validation.
This article is intended to specifically address the use of TOC, but this scale is appropriate for any analytical method being developed for swab (or rinse) sample testing and can be applied to large biological molecules as well as small molecules. The principle simply informs the user whether a method for a given compound can be considered acceptable based on their swab (or rinse) limit. If the HBEL is very low ("Green Zone"), the corresponding swab limit will be very low, too, and will probably surpass the method's DL, and the scale will give a measure of how good that is. The user can simply clean and measure how well they have achieved that using the process capability scale. If they are in the "Red Zone" and the DL is equal to or above the swab limit, they cannot detect the compound at a level that assures meeting the HBEL-based limit. Such methods should not be considered completely useless; they can still be used to demonstrate that residues have been removed close to the limit. However, the user would need to pursue additional steps to provide assurance that the residues are at safe levels, such as demonstration of inactivation, degradation, or decontamination.24
It should be obvious that the DL for TOC is very important, and one of the main goals in swab method development should be to reduce the DL as much as possible. Previously, the limits on the applicability of TOC have been unclear, and this tool may be helpful in such assessments. Prior to this, careful consideration should be given to how DLs are experimentally determined and a standard procedure for determining the DL for TOC should probably be established.
A subsequent article will discuss how these new detectability scales for TOC (or any other analytical method) and for visual inspection3 can be used in conjunction with the HBEL-derived toxicity scale1 and the Cpu-derived probability scale2 as tools to evaluate the level of risk in cleaning.
Peer Review
The authors wish to thank our peer reviewers, Bharat Agrawal; Sarra Boujelben; Gabriela Cruz, Ph.D.; Parth Desai; Ioanna-Maria Gerostathi; Jessica Graham, Ph.D., DABT; Miguel Romero Obon; Laurence O'Leary; John Leahy; and Ersa Yuliza, for reviewing this article and for their insightful comments and helpful suggestions.
References
- Walsh, Andrew, Thomas Altmann, Alfredo Canhoto, Ester Lovsin Barle, David G. Dolan, Mariann Neverovitch, Mohammad Ovais, Osamu Shirokizawa, and Kelly Waldron. "An MSSR-derived Scale for Assessing the Detectability of Compound-Carryover in Shared Facilities," Pharmaceuticalonline.com, December 2017
- Walsh, Andrew, Ester Lovsin Barle, Michel Crevoisier, David G. Dolan, Andreas Flueckiger, Mohammad Ovais, Osamu Shirokizawa, and Kelly Waldron. "An ADE-Derived Scale For Assessing Product Cross-Contamination Risk In Shared Facilities," Pharmaceuticalonline.com, May 2017
- Walsh, Andrew, Ester Lovsin Barle, David G. Dolan, Andreas Flueckiger, Igor Gorsky, Robert Kowal, Mohammad Ovais, Osamu Shirokizawa, and Kelly Waldron. "A Process Capability-Derived Scale For Assessing Product Cross-Contamination Risk In Shared Facilities," Pharmaceuticalonline.com, August 2017
- ICH Q2 (R1): Validation of Analytical Procedures: Text and Methodology International Conference on Harmonisation of Technical Requirements for Registration of Pharmaceuticals for Human Use [ICH], London, 2005.
- Baffi, R. G. Dolch, R. Garnicka, Y. F. Huang, B. Mar, D. Matsuhiro, B. Niepelt, C. Parra, and M. Stephan "A Total Organic Carbon Analysis Method for Validating Cleaning Between Products in Biopharmaceutieal Manufacturing," PDA J Pharm Sci and Tech 1991, 45 13-19
- Gavlik, Walter K., Lane A. Ohlemeir and Herbert Kaiser Analytical Strategies for Cleaning Agent Residue Determination, Pharmaceutical Technology March 1995
- Jenkins, K.M., A.j. Vanderweilen, J.A Armstronmg, L.M. Leonard, G.P. Murphy and N.A Piros "Application of Total Organic Carbon Analysis to Cleaning Validation," PDA Journal of Pharmaceutical Science and Technology Vol. 50, No. 1 January/February 1996
- Strege, Mark A., Tery L Stinger, Brett T. Farrell and Avinash L. Lagu "Total Organic Carbon Analysis for Cleaning Validation of Bioprocess Fermentation Equipment," Biopharm International April 1996
- Holmes, Alison J. and A. J. Vanderwielen "Total Organic Carbon Method for Aspirin Cleaning Validation," PDA J Pharm Sci and Tech 1997, 51 149-152
- Guazzaroni, Maria, Boudin Yiin and Julia L. Yu "Application of total organic carbon analysis for cleaning validation in pharmaceutical manufacturing," American Biotechnology Laboratory September 1998
- Kirsch, Robert Validation of Analytical Methods Used in Pharmaceutical Cleaning Assessment and Validation, Pharmaceutical Technology Analytical Validation 1998
- Clark, Karen A., “Total Organic Carbon Analysis for Cleaning Validation in Pharmaceutical Manufacturing” October 2000
- Wallace, Brian and Stephen Lawson "Detection Selection for TOC Analysis: Analytical Considerations for Cleaning Validation and Purified Water Testing," Teledyne Tekmar White Paper, www.teledynetekmar.com
- Glover, Chris "Validation of the Total Organic Carbon (TOC) Swab Sampling and Test Method," PDA Journal of Pharmaceutical Science and Technology Vol. 60, No. 5, September-October 2006
- Juarbe, Nieves and Mark Strege "Validation of a Method for the Determination of Polysorbate 20 Residues for the Support of the Cleaning of Pharmaceutical Vuial Closures," Journal of Validation Technology February 2007, Vol. 13, No. 2
- Frey, Benjamin, David Koczan, and Kenneth Shrout "Implementing a Compliant Cleaning Program in the Dietary Supplement Industry," Contract Pharma/Nutraceuticals World Manufacturing Supplement, March 2007
- Bader, Keith, John Hyde, Peter Watler and Amber Lane "Online Total Organic Carbon (TOC) as a Process Analytical Technology for Cleaning Validation Risk Assessment" Pharmaceutical Engineering January/February 2009
- Clifford, Robert and Minako Tanaka "Carbon Measurement Methods for Cleaning Validation: Comparing Direct Combustion with Rinse and Swab Sampling Methods," Pharmaceutical Technology Europe August 2012
- Xue Li, Imad A. Haidar Ahmad, James Tam, Yan Wang, Gina Dao and Andrei Blasko " Cleaning verification: A five parameter study of a Total Organic Carbon method development and validation for the cleaning assessment of residual detergents in manufacturing equipment," Journal of Pharmaceutical and Biomedical Analysis 149 (2018) 33–39
- Vander Heyden, Yvan and Ricard Boqué “The Limit of Detection,” LCGC Europe 2009 Volume 22, Issue 2, pg 82–85
- Walsh, Andrew, Michel Crevoisier, Ester Lovsin Barle, Andreas Flueckiger, David G. Dolan and Mohammad Ovais "Cleaning Limits—Why the 10-ppm and 0.001-Dose Criteria Should be Abandoned, Part II," Pharmaceutical Technology 40 (8), 45-55 (2016).
- FDA Guide to Inspections: Validation of Cleaning Processes, July 1993, U.S. Food and Drug Administration (FDA), www.fda.gov.
- ISPE, Baseline® Pharmaceutical Engineering Guide: Risk-Based Manufacture of Pharmaceutical Products: A Guide to Managing Risks Associated with Cross-Contamination. (ISPE, Tampa, FL, ed. First, 2010), vol. 7, pp. 186.
- Walsh, Andrew "Cleaning Validation for the 21st Century: Can Alternative Approaches to the PDE-ADE be Justified?" Biopharm International October 2015