
Causal Mechanism And Effect Analysis (CMEA): FMEA's Simpler, Effective Alternative
By Mark F. Witcher, Ph.D., biopharma operations subject matter expert

The risk analysis method most widely used in the pharmaceutical and medical device industries is FMEA (failure mode and effect analysis). This article describes CMEA (causal mechanism and effect analysis) as an alternative to FMEA for analyzing and managing the industry’s risks by clarifying and simplifying concepts presented in a previous article proposing a modified version of FMEA.1
Because FMEA and its many variants are also extensively used in many industries, FMEA exists in numerous forms and is described in countless books, articles, and procedures. However, FMEA did not originate as an all-purpose risk analysis method. According to Stamatis, FMEA was created to be:
an engineering technique used to define, identify, and eliminate known and/or potential failures, problems, errors, and so forth from the system, design, process, and/or service before they reach the customer.2, 3
For those who are not satisfied with FMEA and its results, especially those misusing it as a broadly applicable method for analyzing a portfolio of diverse risks, this article reenvisions FMEA and evolves it into CMEA to provide a flexible approach that is simple to use and effective for modeling, analyzing, understanding, and managing any risk.
A Fundamental Understanding Of Risk
While FMEA views a risk in terms of failure modes and their ability to produce effects, a more detailed examination of the fundamental behavior of a risk can provide a more complete definition of a risk, greatly simplifying how risks can be analyzed.
ISO 31000 defines a risk as “the impact of uncertainty on an objective” and ICH Q9 defines a risk as “the combination of severity of impact and the probability of occurrence.”4, 5 Clearly, both definitions describe risks as events. The definitions appear to be the result of the widespread belief by the risk analysis community, especially the “experts,” that the universe is composed of just events, resulting in the logical misinterpretation that risks must also be modeled as just events, such as failure modes and effects.
However, viewing risk as just events is not consistent with the observation that no event occurs spontaneously. Every event is produced and controlled by some kind of process, system, or actions initiated by a prior event that can be explained as passing through what Wesley Salmon calls a “causal process”6 that can be described as a “causal mechanism”7, 8, 9 that, most importantly, can be used to provide a “causal explanation”10, 11 of why one event produces another event.
If risks are viewed as connected relationships between events, then risks can be modeled as sequences of a basic risk element shown in Figure 1, which explains a relationship of a cause event, a causal mechanism (CM), the CM’s possible failure modes, and the risk’s outcome or effect event.
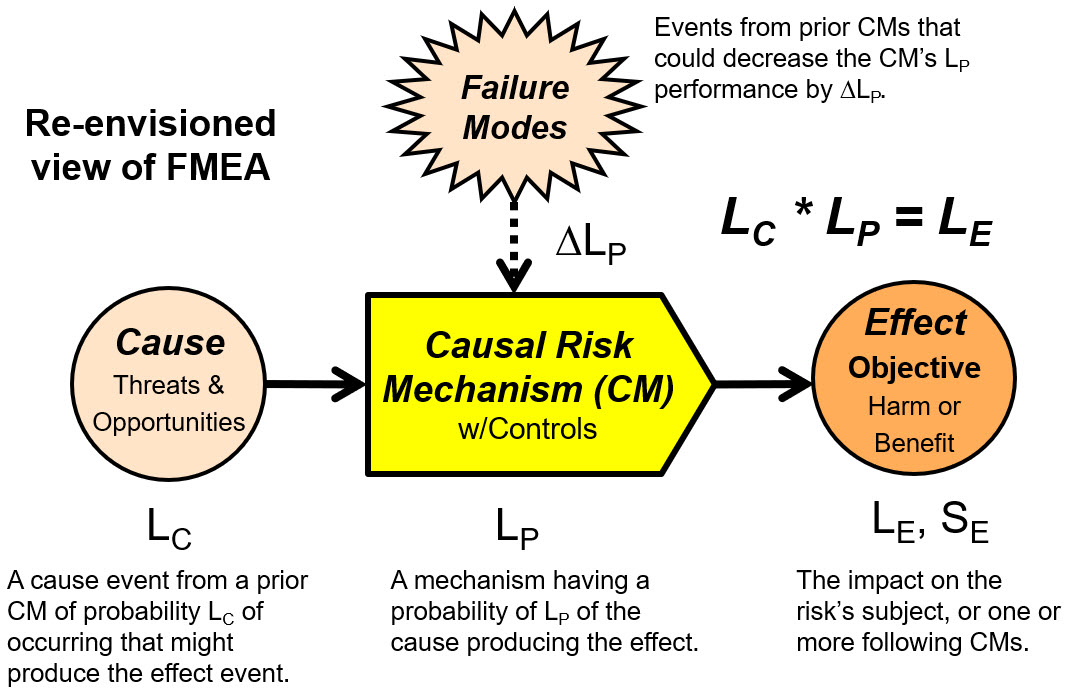
Figure 1: An alternative view of a risk modeled as a connected relationship between events. A cause event, always originating from a prior CM, of probability LC, has a probability of LP of passing through the risk’s CM, producing an effect event to a subject or following CM of probability LE and severity of SE. LE is calculated as the mathematical product of LC and LP. Failure modes (FMs), if they occur, degrade by ∆LP the probabilistic performance LP of the CM achieving its desired outcome.
Another critical observation is that risks must be managed by changing or managing the processes, systems, and actions that produce the risk’s outcome event. One can reasonably conclude that risk should be analyzed using the same modeling methods by which they must be ultimately managed.
The model structure shown in Figure 1 gives rise to two different types of risks depending on whether the objective of the CM is to prevent a harm event or achieve a beneficial objective. Understanding and using the two types of risk can greatly simplify the challenge of analyzing a wide variety of diverse risks.
Analyzing Harm And Benefit Risks
A risk structure for preventing a harmful event is shown in Figure 2.
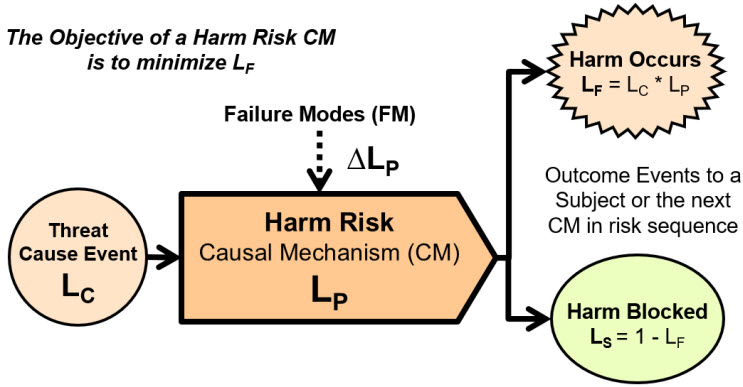
Figure 2: Harm risk structure describing a threat event of probability LC entering a harm risk CM that has a probability LP of preventing the harm event of probability LF from occurring. The probability of the harm event occurring is LF = LC * LP. The CM’s failure modes increase the probability of the harm event occurring by increasing LP by ∆LP. The threat cause event occurs from a prior CM in a risk sequence that may or may not be included in the analysis. Both possible outcomes may impact the risk’s subject or one or more of the following CMs in the risk’s sequence.
The harm risk model is useful for analyzing and managing the probability of a harmful event occurring to an acceptably small probability. Reason’s Swiss cheese risk model is a visual representation of a harm risk with the layers of cheese crudely describing the CMs that block the threats from resulting in a harm event.12
The harm risk model is essential for understanding safety risks where a CM may not have an acceptable probability of preventing a threat or hazard, defined as a continuous threat, from resulting in a harm event. Other applications of a harm model include preventing the flow of a contaminant through contamination control systems (CCSs) to contaminate products, in-process materials, facilities, equipment, or people.13
However, the second type of risk, the benefit risk shown in Figure 3, is very useful for describing, analyzing, and managing many very important risks, especially pharmaceutical and medical device risks, including those associated with designing and operating pharmaceutical and medical device manufacturing facilities.
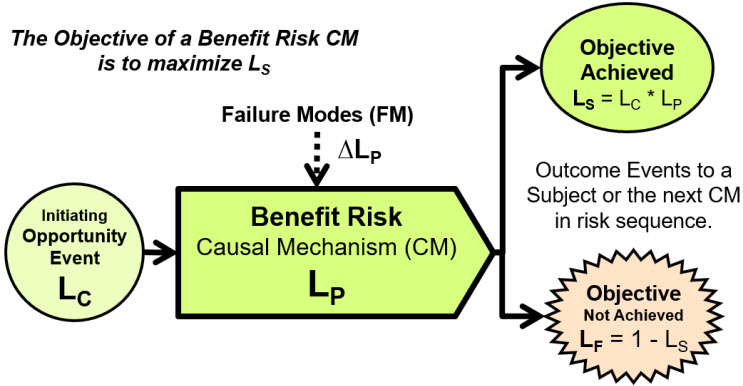
Figure 3: A benefit risk element for an opportunity event, usually intentionally initiated (LC = 1), seeking to achieve a beneficial objective. The CM has a probability LP of successfully producing or achieving the desired outcome with the probability of success LS = LC * LP. The opportunity event may originate from a prior CM in a risk sequence. The two possible outcomes occur to either a final subject or a following risk’s CM.
A benefit risk structure describes risk that seeks to achieve a beneficial event, usually in the form of an objective. Two especially important pharmaceutical and medical device benefit risks are procedures and supply chains.14, 15 A benefit risk analysis method can also be used to rigorously analyze CCSs associated with controlling contamination of final products.13 Using benefit risk models is especially effective for minimizing human errors by positively analyzing and managing CMs that support human activities to make both the human and the CM successfully achieve their objectives.16, 17
For both risk models to be effectively used, a method for efficiently characterizing and communicating both the severity of the effect event’s impact and the risk’s probabilities is required.
Describing And Communicating A Risk’s Attributes
While FMEA uses highly subjective and analysis-specific RPN (risk priority number) rating tables to characterize an effect’s significance based on the risk’s severity, likelihood of occurrence, and sometimes on its detectability, CMEA uses a much more straightforward approach for describing the risk’s attributes.
The best approach for managing severity is for the analysis team to define the severity or significance of the risk’s outcome as a modeling assumption. If appropriate, more than one severity can be analyzed. A well-defined severity is critical for estimating the outcome’s likelihood of occurrence.
The severity of a risk event can best be described, at least initially, by a monetary cost impact.1 A severity rating can be generated as SX^ = Log10($ impact) appropriately scaled for the size of the enterprise and the monetary units used. For example, an impact of $1,000 would be SX^ = 3. The severity scale ranges from 1 ($1) to 7+ ($10 million+), providing a simple order of magnitude (OoM) number describing the risk’s impact.
While methods exist for adjusting severity based on personal injury or death to monetary equivalents, such as the value of a statistical life (VSL), willingness to pay (WTP), and the precautionary principle, making such judgements should be left to the risk analysis team responsible for the specific risk outcomes being analyzed.18, 19
The severity of a harm risk consequence is typically valued as a loss. However, the significance of a benefit risk may be considerably more difficult to value in terms of the investment cost of attempting to realize the objective, loss of value that occurred from not achieving the objective, etc.
While reaching a consensus on severity is relatively straightforward, estimating the probability of the severity being realized can be considerably more challenging. The approach used with CMEA is to view the probabilities as a single-trial Bernoulli probability distribution where the outcome is either a failure or a success.
Many risks are sequences of CMs, all of which can be modeled as either a harm or benefit risk, with some risks evaluated as a combination of the two types within the risk’s CM sequence. Managing both benefit and harm risks requires a probability rating device constructed using a single-trial Bernoulli probability distribution where the probability of success and failure sum to one (LS + LF = 1). Table 1 describes a rating method for handling both the low probabilities associated with harm risks and the high probabilities required for analyzing and managing benefit risks.
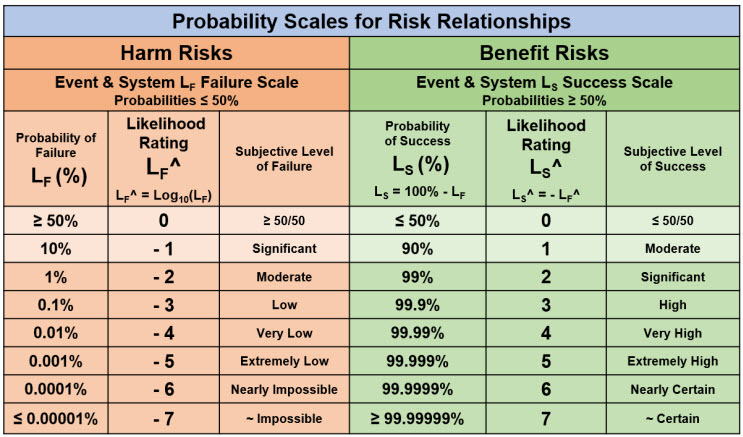
Table 1: Probability and likelihood rating scales for managing both harm and benefit risks. The likelihood rating is constructed by setting LF^ = Log10(LF) for probabilities less than 50%. For probabilities greater than 50%, the probabilities are calculated as LS = 1 – LF and ratings set using LS^ = - LF^. The resulting device allows for probabilities of likelihood ratings to be easily described and translated between success and failure using the relationship LS^ = - LF^.
The attribute chart in Table 1 is sufficient for analyzing and describing a risk because the ultimate goal of a risk analysis is only deciding if the risk has an acceptable probability of occurrence given its impact significance. To make that straightforward yes or no decision, only OoM estimates for SX and LX are required. Given the inherent uncertainty of most future events, making more precise guesstimates of probabilities without having a very large amount of good historical data generated from comparable CMs is potentially self-deceiving with respect to the accuracy of the estimates.
In addition, any estimate by a risk analysis team of the probability of a future event is essentially a belief. While probabilities from mathematically defined CMs can be calculated, for virtually every CM in the real world, especially those containing human activities, the outcome probabilities cannot be calculated and will always be a belief based on the data and information from comparable events and causal mechanisms reviewed by the risk analysis team.
One quick method of deciding if the outcome risk event might be acceptable is to compare estimated values of SX^ and LX^ using an ARL (adjusted risk likelihood) rating calculated as ARL = LX^ + SX^ where LX^ is the failure likelihood rating of the event.20 Calibrating an acceptance criterion such as considering a 0.1% (LX^ = - 3) chance of losing $1,000 (SX^ = 3) as an acceptability limit might produce the belief that positive ARLs are unacceptable and negative values might be acceptable.
If the risk is deemed to be unacceptable by the analysis team, then the risk’s CMs can be modified appropriately, usually by controlling FMs or adding additional controls implemented as improvement opportunities (IOs) to make the failure rate LF^ of the risk acceptable given SF^, again to an OoM level of precision.
Both benefit and harm risks are usually composed of a sequence or network of CMs that describes a system risk structure (SRS) providing a process flow chart-like representation, such as HACCP (hazard analysis and critical control point), that describes the risk from the initial cause event to the final outcome as an objective or consequence event.21 Once the CM flow chart SRS is created, each CM can be analyzed by using the basic risk element shown in Figure 1.
Analyzing A System Risk Structure (SRS)
Expanding the Bowtie risk analysis modeling concept to a top risk using Figure 1 is shown in Figure 4. It is an approach for analyzing a risk’s sequence of CMs that can be applied from the initial cause event through the CM sequence to the final outcome of the risk.
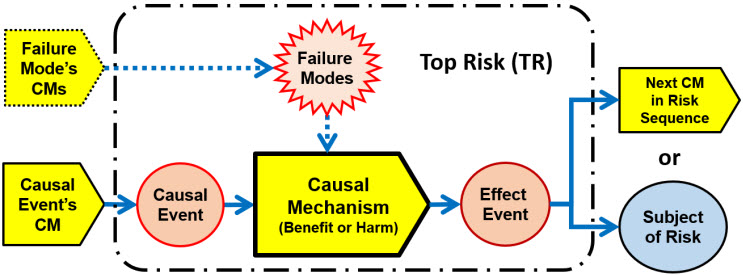
Figure 4: Top risk SRS format for analyzing each risk element in a risk’s sequence of CMs. A similar approach can be used for analyzing the CMs associated with the failure mode events.
The results of the TR analysis method shown in Figure 4 can be easily described and documented for discussions by the risk analysis team using the worksheet tables shown in Figure 5.
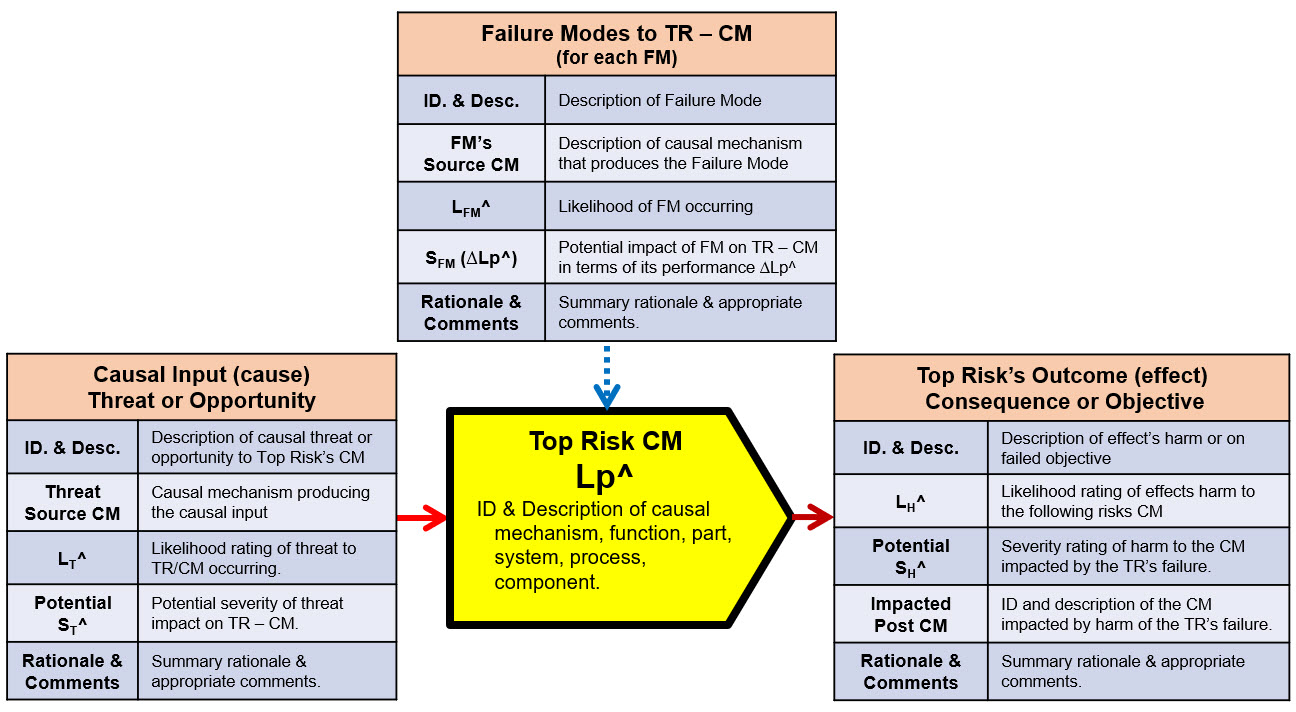
Figure 5: Risk analysis worksheets for analyzing, discussing, and documenting risks using a top risk concept shown in Figure 4. The figure describes the causal input event, the failure modes that impact the risk’s CM (one for each significant failure mode), and the risk’s outcome effect event. The severity of an FM is the ∆LP^ impact on the TR-CM’s LP^. If any of the risks cause input, CM, or outcome change, then a different risk is described.
Click on image to enlarge.
The tables in Figure 5 describe each of the parameters that should be considered in analyzing the risk of the CM-effect pairs in the SRS’s risk sequence. A possible risk register for documenting a top risk model for each CM element is shown in Table 2.
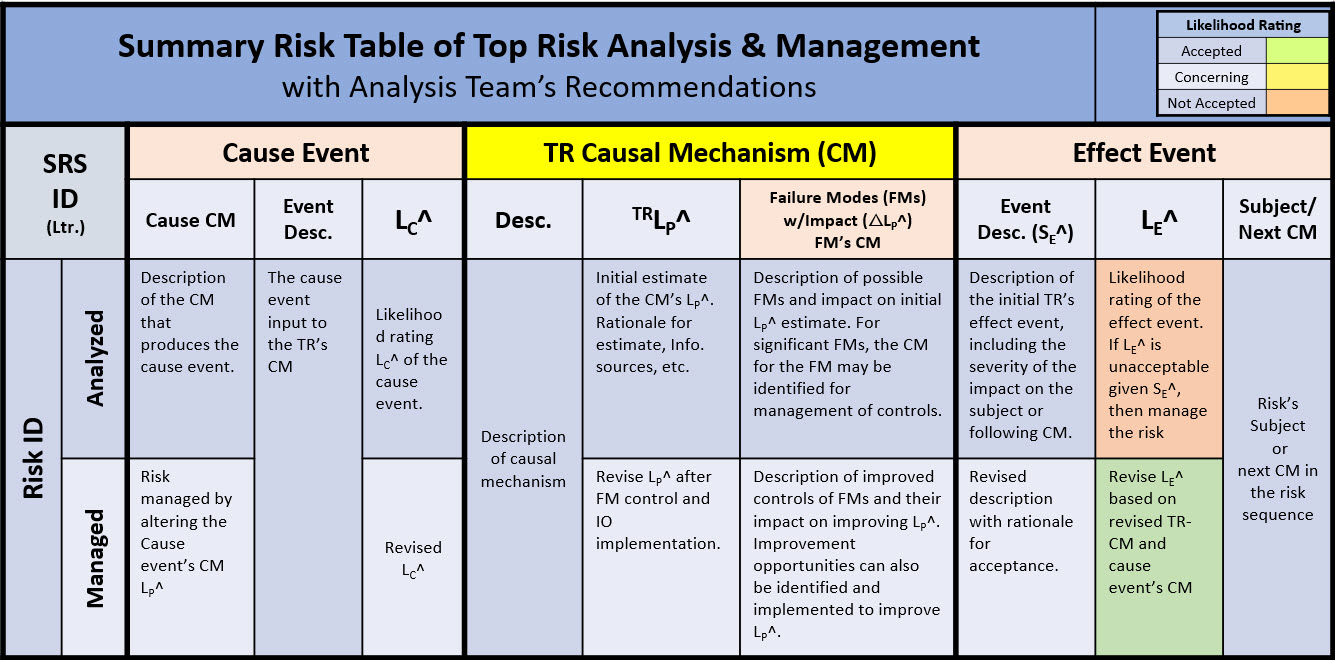
Table 2: A suggested risk register format for documenting each CM element in a risk using the top risk model shown in Figure 4. The risk element can be managed in two ways. The first is to manage the likelihood of the cause event. The second is to manage the risk element’s CM to improve the likelihood of a beneficial effect event occurring.
Click on image to enlarge.
While Table 2 provides an effective RR for describing the top risk element, a more concise summary version is used for documenting the example later in this article.
Figure 6 expands the top risk model shown in Figure 5 for modeling complex risks as networks of CM/event elements that include risk branching based on the success or failure of the top risk CM element.
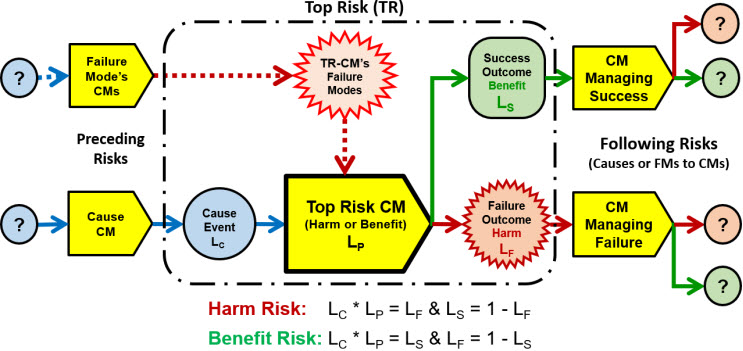
Figure 6: Top risk SRS describing how a complex risk might branch into separate risks to describe the risks associated with both the success and failure of the TR-CM. In many risks, the next CM in the primary risk sequence receives the outcome regardless of whether it is a success or failure.
The top risk model shown in Figure 6 can be used to model very complex risks as networks of risk sequences for describing how risks might interact. While the complex risk model provides more understanding of how risks work, the modeling of complex risks using Figure 6 is left for the future.
The Challenge Of Estimating A Risk’s Attributes
Any risk analysis requires estimating the attributes. Estimating RPNs for analyzing risk events has the same challenges; however, RPN estimates, including those used for constructing risk matrices, are based on very little information, mostly derived from historical data from CMs that are assumed, sometimes implicitly, to be comparable CMs to those that might produce the future events.
However, the LP^ values for the CMs and the ∆LP^ of the FMs that impact the risk’s LPs, as well as the likelihood LFM^ of the FMs occurring, can be made using information from a wide variety of sources. The LPs, ∆LPs, and LFM^ can easily be estimated to an OoM using the consensus of qualified experts based on their past experience and knowledge, including a statistical analysis, of similar CMs. Where possible, the LP estimates can be refined using testing, qualification, and process validation methods.
Undoubtedly, as the use of CM‑based risk analysis methods advances, approaches and techniques for estimating the risk’s attributes will be further developed to improve the industry’s ability to evaluate and estimate the LPs of a wide variety of CMs.
The methods described above can be explained using the following simplified example.
Example Risk – Operating An Autoclave
The use of both the benefit and harm risk structures can be explained using the following example. The objective of running an autoclave is to achieve the benefit of sterilizing a load of parts or components. The overall risk is a benefit risk shown in Figure 7.
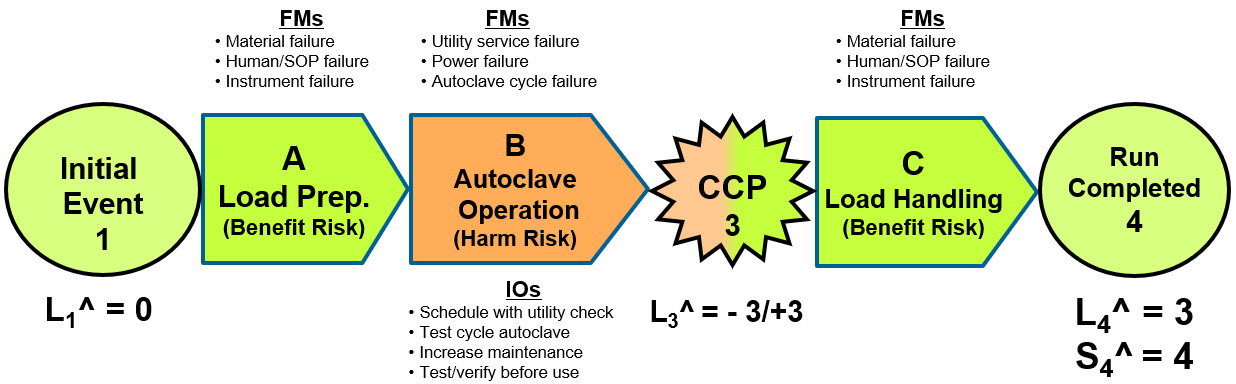
Figure 7: A system risk structure (SRS) describing the three CMs of the risk of operating an autoclave. The overall risk is described as a benefit risk, with the second CM treated as a harm risk. The SRS describes probabilities as likelihood ratings as shown in Table 1. A risk register for the risk is provided in Table 3.
Click on image to enlarge.
For brevity, the overall risk is divided into three CMs: load preparation (A), autoclave operation (B), and sterilized load handling (C). A critical control point (CCP) is added for monitoring after the autoclave CM–B. By convention, CMs are lettered and events numbered.
The example risk can be efficiently described and communicated using the RR shown in Table 3.
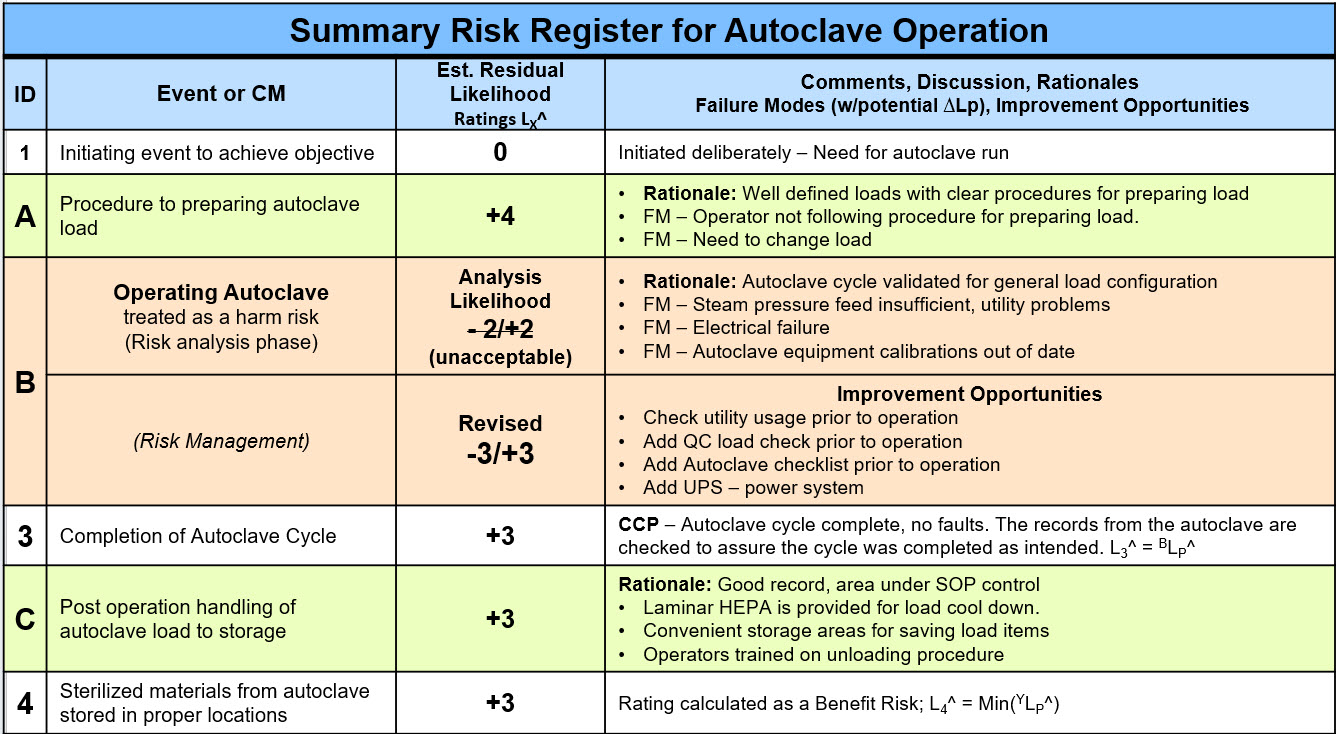
Table 3: Summary risk register for autoclave operating risks shown by the SRS in Figure 7 evaluated as a benefit risk. The analysis includes treating the autoclave’s operation as a harm risk failure rate with appropriate translation into a benefit risk rating. The analysis in the RR includes management of an unacceptable CM.
Click on image to enlarge.
The autoclave risk described in Table 3 was both analyzed and managed. The analysis found that the autoclave operating risk had an unacceptable failure rate, and improvement opportunities (IOs) were identified and added to improve CM-B’s failure rate BLF^ from minus 2 to minus 3.
Additional examples of using a CMEA-like analysis can be found in previous articles, including links.1, 13, 14, 15, 16, 17, 21
Summary And Final Thoughts
This article describes CMEA for efficiently and effectively analyzing, managing, and documenting a wide variety of risks. Because of its simplicity, the analysis method provides an effective means for the analysis team to communicate a risk analysis to management, executives, and regulatory groups that need to interpret and understand the results of the analysis to make decisions.
Once a risk analyst changes their understanding from viewing risks as bad events to bad CMs that might produce bad events, the analysis and management of risks become considerably easier. While the approach presented might seem overly simplistic, a risk analysis should always start simply and build in complexity to an appropriate level of detail and understanding depending on the significance of the risk’s outcome. The complexity of any risk is determined by the complexity of the risk’s CMs. As experience with CMEA expands with usage, many additional features, methods, and tools will be developed to increase its efficiency and effectiveness.
Risk analysis will not become a truly scientific and engineering discipline until it recognizes that the primary element of a risk is its causal mechanisms and then uses sound engineering, scientific, and business principles to analyze the risk’s causal mechanisms.
References
- Witcher, M., System Failure Mode & Effect Analysis (SFMEA): An Alternative Approach For Analyzing Risks, Med Device Online, June 24, 2024. https://www.meddeviceonline.com/doc/system-failure-mode-effects-analysis-sfmea-an-alternative-approach-for-analyzing-risks-0001
- Stamatis, D. Failure Mode and Effect Analysis, 2nd Ed., ASQ Quality Press, 2003. (842 pages) Kindle Edition.
- Omdahl, T. P, ed. 1988. Reliability, availability, and maintainability dictionary. Milwaukee: ASQC Quality Press.
- ISO 31000:2018 – Risk Management Guidelines – Principles and Guidelines, International Organization of Standardization, 2018.
- ICH Q9 (R1) – Quality Risk Management, FDA, May 2023.
- Salmon, W., Scientific Explanation and the Causal Structure of the World, Princeton University Press, 1984,
- Machamer, P, L. Darden, & C. Carver, “Thinking About Mechanisms”; Philosophy of Science, University Chicago Press, 2000.
- Glennan S., “Rethinking mechanistic explanation”, Philosophy of Science 69.3 (2002)
- Glennan, S., The New Mechanical Philosophy, Oxford University Press, 2017.
- Bechtel, W., Discovering Cell Mechanisms – The Creation of Modern Cell Biology, Cambridge Studies I Philosophy and Biology, Cambridge University Press, 2006.
- Carver, C. & L. Darden, In Search of Mechanisms – Discoveries across the Life Sciences, The University of Chicago Press, 2013.
- Reason, J., Managing the Risks of Organizational Accidents, Ashgate Publishing Company, 1997.
- Witcher, M., Managing Contamination Risks In The Pharmaceutical And Medical Device Industries Using Relational Risk Analysis, Bioprocess Online, February 2025. https://www.bioprocessonline.com/doc/managing-contamination-risks-in-the-pharmaceutical-and-medical-device-industries-using-relational-risk-analysis-0001
- Witcher, M., Using Relational Risk Analysis to Control Procedure Failures in the Bio/Pharma & Medical Device Industry, February 15, 2024. https://www.bioprocessonline.com/doc/using-relational-risk-analysis-to-control-procedure-failures-in-the-bio-pharma-medical-device-industry-0001
- Witcher, M.F., Managing Supply Chain Risks Using Relational Risk Analysis, April 5, 2024. https:// www.meddeviceonline.com/doc/managing-supply-chain-risks-using-relational-risk-analysis-0001
- Witcher, M., A New Approach for Minimizing Human Errors in Biopharmaceuticals and Medical Devices, Bioprocess Online, February 3, 2025. https://www.bioprocessonline.com/doc/a-new-approach-for-minimizing-human-errors-in-biopharmaceuticals-and-medical-devices-0001
- Witcher, M., Controlling Human Errors using Relational Risk Analysis, Pharmaceutical Online, August 4, 2025. https://www.pharmaceuticalonline.com/doc/minimizing-the-impact-of-human-errors-using-relational-risk-analysis-0001
- Sunstein, C., Risk and Reason – Safety, Law, and the Environment, Cambridge University Press, 2002.
- Sunstein, C., Laws of Fear – Beyond the Precautionary Principle, Cambridge University Press, 2005.
- Witcher, M., Rating Risk Events: Why Adjusted Risk Likelihood (ARL) Should Replace Risk Priority Number (RPN), Bioprocess Online, April 7, 2021. https://www.bioprocessonline.com/doc/rating-risk-events-why-we-should-replace-the-risk-priority-number-rpn-with-the-adjusted-risk-likelihood-arl-0001
- Witcher, M., Reimagining HACCP And Other Process Flow Risk Analysis Methods Using Relational Risk Analysis, Process Online, December 17, 2025. https://www.bioprocessonline.com/doc/reimagining-haccp-and-other-process-flow-risk-analysis-methods-using-relational-risk-analysis-0001
About The Author:
 Mark F. Witcher, Ph.D., has over 35 years of experience in biopharmaceuticals. He currently consults with a few select companies. Previously, he worked for several engineering companies on feasibility and conceptual design studies for advanced biopharmaceutical manufacturing facilities. Witcher was an independent consultant in the biopharmaceutical industry for 15 years on operational issues related to: product and process development, strategic business development, clinical and commercial manufacturing, tech transfer, and facility design. He also taught courses on process validation for ISPE. He was previously the SVP of manufacturing operations for Covance Biotechnology Services, where he was responsible for the design, construction, start-up, and operation of their $50-million contract manufacturing facility. Prior to joining Covance, Witcher was VP of manufacturing at Amgen. You can reach him at witchermf@aol.com or on LinkedIn (linkedin.com/in/mark-witcher).