
7 Steps To Navigate Six Sigma's "Improve" Phase
By Steven Zebovitz, R.Ph., Ch.E.

In this series, we’ve covered quite a bit of ground in providing a working understanding of Six Sigma and its DMAIC (Define, Measure, Analyze, Improve, Control) roadmap for problem solving and product/process improvement.
In the first article, we started with an introduction to Six Sigma, its various ranks, the expectations of each belt, and the returns it offers to pharmaceutical manufacturers. In the first of the DMAIC steps, the Define stage, we learned about project charters, inclusion of various professional roles in the process, and the definition itself, which provides a problem statement, a magnitude of improvement, and a timeline. The Measure stage involves collecting unbiased, random, precise, and holistic data from which to base future decisions. And in the Analyze phase, we discussed the breadth and depth of data analysis and looked at two examples.
At this point, you should have a clear picture of what makes the DMAIC process tick. In other words, we have expressed the outputs (the Y’s) in terms of the inputs (the X’s). Put another way, our cause-and-effect relationship is expressed as follows:
Y = f(x1, x2, x3, …)
Most importantly, we’ve made a differential diagnosis that our formula is a true causation, not a simple correlation that might occur by happenstance. Our outputs are truly a result of our inputs.
Now that we know how the outputs vary with the inputs, we can adjust our inputs accordingly, with a sense of process understanding, and methodically. This is known as the Improve phase.
The steps to follow for success during the Improve phase are as follows:1
1. Construct a set of likely solutions to the problem definition.
Recall that we specified a problem and a magnitude of improvement. We’ve diagnosed its root cause(s), and we know which inputs must be adjusted to achieve the specified improvements in our process or product. Now we must agree on those adjustments.
To do so, we refer to the results of our Analyze phase. Our validated cause-and-effect relationships (also known as main components or principle components) tell us the magnitude of effect, and we should exploit the most efficient inputs to adjust. We aim for a robust process generating a robust product by identifying sources of variation and working to reduce them. Our process understanding is key, but so are regulatory, staffing, and equipment restrictions — all should be considered as likely improvements are devised. Also, remember that the voice of the customer must ring loud and clear. In other words, begin with the end in mind. Document all potential solutions.
2. Select and modify the best solutions.
Often a single input might be sufficient, but interactions between multiple inputs should be considered. George et al lists excellent techniques of selection criteria.2
3. Report the anticipated value stream map.
Inform the Six Sigma committee of the new process and its anticipated benefits, such as quality enhancements, reduction of variability, cost savings, improved yields, etc. Comments and critiques from a larger audience are highly beneficial.
4. Test the proposed solutions in a pilot scale.
This step allows the Six Sigma team to validate improvements using a minimum of materials and, hopefully, time. In the matrix started during Step 1, document the results. To reduce noise components, run multiple trials. As always, document your results. Note that multiple pilot phases may be required to fully exploit the inputs to achieve your project definition, and multiple phases must be part of the project budget. Carrying the process to regulatory or equipment limits will help determine its design space and investigate a process improvement’s edge of failure. Discussion whether to exceed the regulatory limitations for experimental purposes only may expand the design space for future process understandings. Lastly, if resources permit, additional validation testing is prudent to ensure that the product remains within its approved criteria.
5. Determine if the project goal was attained.
This is self-explanatory. It functions as a critical review step by the Six Sigma committee. Did the project achieve its expressed goals? Attainment and successful passage of the Six Sigma team review initiates change control processes in advance of the launch of full-scale runs.
6. Conduct full-scale runs.
It is advisable to perform validation testing during these runs to ensure that scale-up factors, such as mass effects, remain within their approved status. Ideally, multiple full-scale runs are conducted. This phase determines if the project definition goals are met at full scale. This data enters into change control documentation.
7. Implement the solution into commercial manufacturing.
At this juncture, a stage gate review determines if the project goal is, in fact, achieved at manufacturing scale. Closure of change controls and the regulatory process are necessary before the process is mainstreamed into commercial manufacturing.
An Improvement Phase Example
A number of improvement techniques are available — some as obvious as interviewing process operators, others relying on correlations that have been vetted by a design of experiments (DoE). In cases where correlations are strong, standard calculus techniques (e.g., derivatives) can lead the way to improvement.
Let’s look at an example of constructing a set of likely solutions. I've chosen the JMP sample file Vinyl Data.jmp3, which is a mixture experiment. This is akin to the product development phase of drug production, where a final formulation and process are the goals. In contrast, ongoing commercial manufacturing has limited wiggle room regarding scale-up and post-approval changes (per the SUPAC guidances) and process parameter adjustments. This file presents results from DoE consisting of 28 experiments, wherein extrusion rate, ingredients ratios, and thickness are combined to give a desirability rating. The JMP profiler graphically presented the initial results as follows:
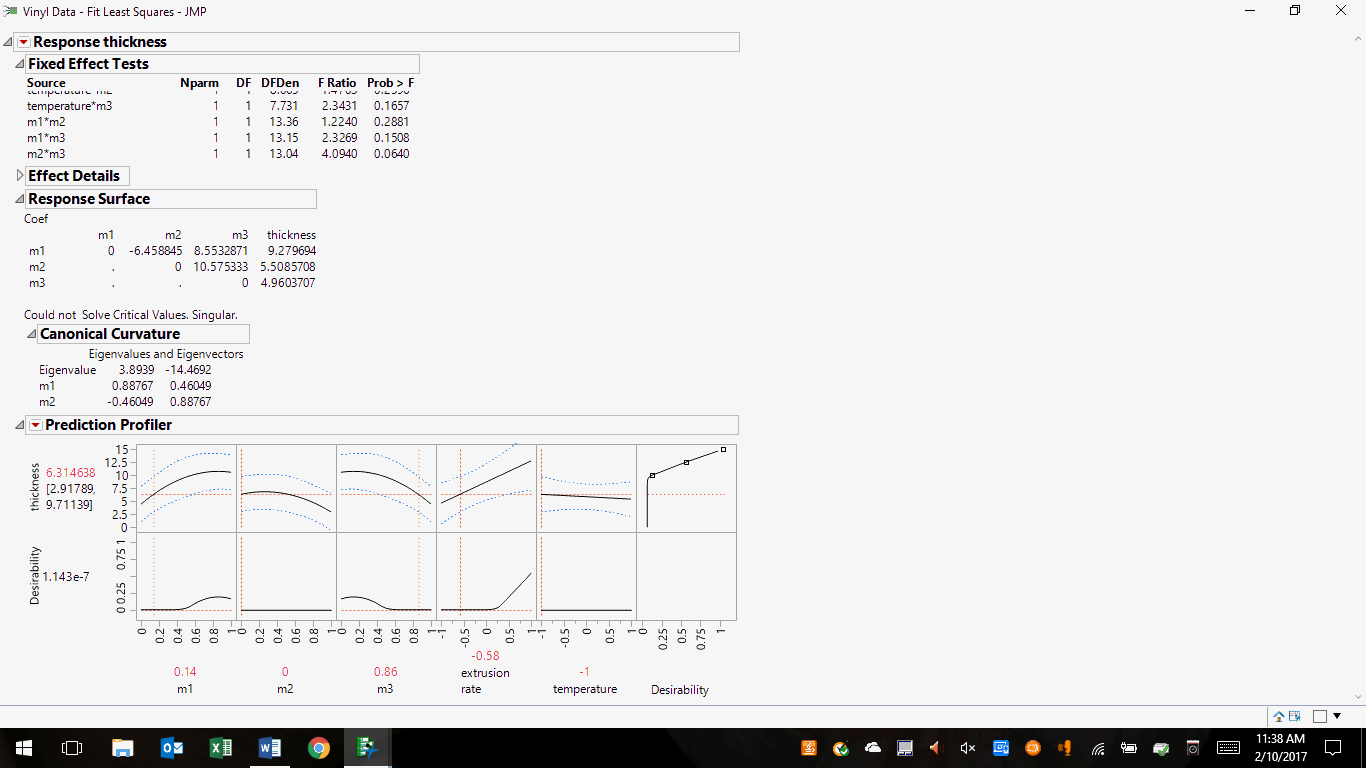
Figure 1: Initial results of the design of experiments (DoE) for Vinyl Data.jmp
In the first row of images, note that desirability is nil, yet the product thickness is sensitive to ingredients m1, m2, m3, and extrusion rate as noted by the curvature and slopes of their plots. Conversely, the process is insensitive to temperature as shown by its flat line. However, desirability is sensitive to ingredients m1, m3, and extrusion rate, and insensitive to m2 and temperature. At this point, our DoE has given us considerable process understanding. The profiler itself will help direct the experimenters’ next step.
The same data can be optimized using the profiler tools, as follows:
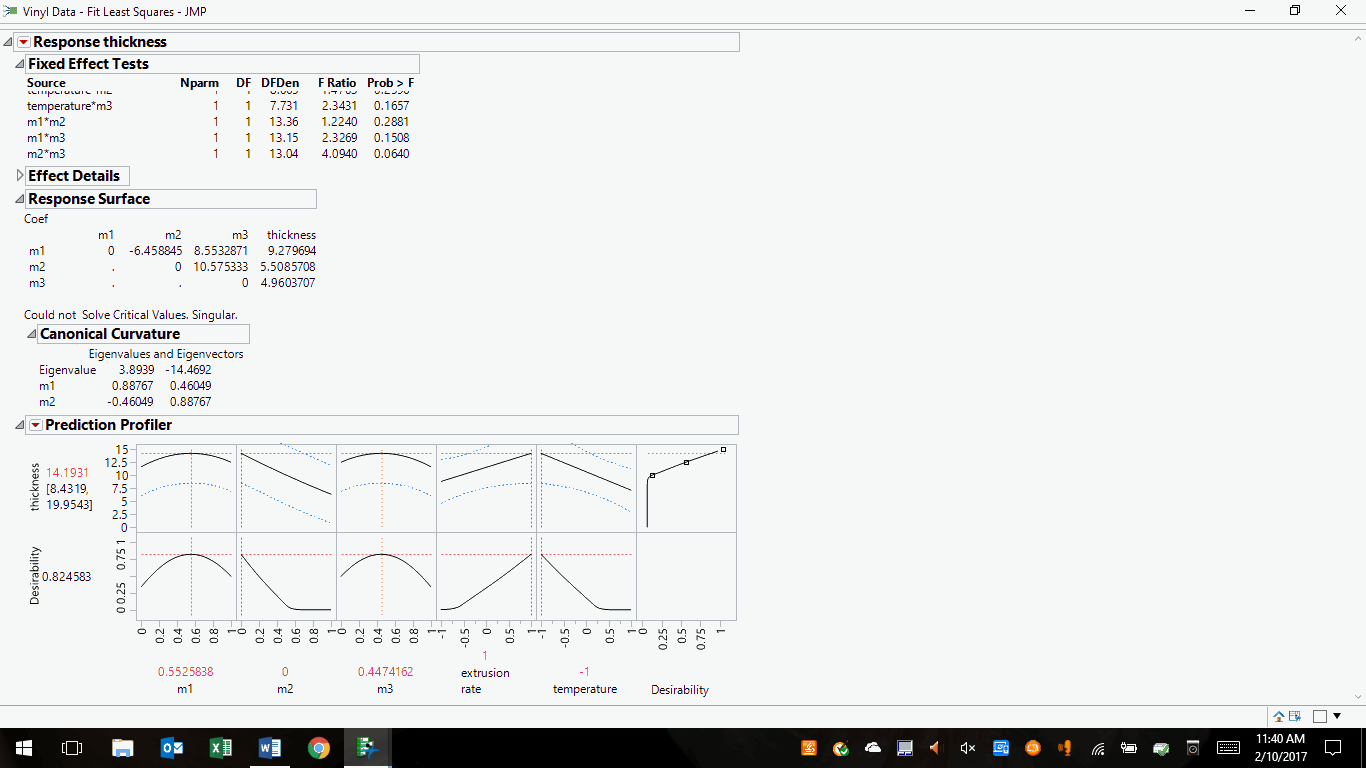
Figure 2: Optimized desirability for a vinyl mixture and process parameters
Desirability has been maximized and the sensitivities of all ingredients and process parameters have shown a stronger influence in the final product. In other words, we have arrived at a set of likely solutions that can be selected and modified to achieve the best solutions within regulatory guidelines, equipment/facilities/staff capabilities, and cost. One should test the mixture and process at the pilot scale, tabulate results to determine if the project goal was attained (i.e., the effectiveness of the DoE), conduct full-scale runs, perform the necessary regulatory filings/reporting, hold to your company’s change control procedures and business reporting requirements, and implement the solution into commercial manufacturing.
(For an in-depth analysis into mixture design, see Snee & Hoerl4.)
Closing Remarks
The Improve phase relies heavily on measurements taken in support of the problem definition. From the analysis of that data, we can formulate likely solutions, or combinations of adjustments to input variables, that will have the most expeditious improvement. Software is helpful, as demonstrated in the example above, and the input of the Six Sigma team can augment the effectiveness of likely solutions.
I hope this discussion of the Improve stage of the DMAIC process has piqued your interest to seek formal training and mentorship in Six Sigma to aid in your company’s success. My series of articles provide only a high level of introduction. Much more is to be gained through didactic training and hands-on experience.
The author thanks his Six Sigma teacher and mentor, Joseph Ficalora (joeficvfr@yahoo.com, 973-727-3788) for his critique of this manuscript. Mr. Ficalora is a Lean Six Sigma Master Black Belt and deployment coach.
References
- George, M.L., et al, The Lean Six Sigma Pocket Tool Kit, The McGraw-Hill Companies, USA (2005), p. 15.
- Ibid, pp. 256, 258, and 265.
- From the JMP data file notes: “This example is adapted from Kowalski, S.M., Cornell, J.A., and Vining, G.G. (2002) “Split Plot Designs and Estimation Methods for Mixture Experiments with Process Variables,” Technometrics 44: 72-79. Kowalski and Cornell modified the example found in Cornell, J.A. (1990) Experiments with Mixtures (2nd edition), pp 377-383.”
- Snee, R., and Hoerl, R., Strategies for Formulations Development: A Step-by-Step Guide Using JMP, SAS Institute Inc., Cary, NC (2016).
About the Author
 Steven Zebovitz, R.Ph., Ch.E., has three decades of pharmaceutical engineering and manufacturing experience in oral solid dose. Much of his experience is in engineering and manufacturing support, including leadership positions in technology transfer, technical services, process scale-up, validation (PV and CV), optimization, and implementation of data-based quality systems. He led a Six Sigma deployment that yielded 10 Black Belts and one Master Black Belt. His interests include process excellence, lean manufacturing, and championing teams. He may be reached at stevenzebovitz@comcast.net, www.linkedin.com/in/stevenzebovitz/, or 215-704-7629.