
Using System Risk Structures To Understand And Balance Risk/Benefit Trade-offs
By Mark F. Witcher, Ph.D., biopharma operations subject matter expert
The ICH 31000 guidance defines a risk as the “impact of uncertainty on objectives.”1 The definition describes “a risk” as including both benefits (good outcomes) and bad outcomes (risk consequences). As described in ICH Q9, all risks have two attributes – severity of impact and likelihood of occurrence.2 Any effective risk management approach should be able to simultaneously describe and manage both good and bad “risks.”
The purpose of this article is to describe how system risk structures (SRSs)3,4,5 can be used to simultaneously understand and manage both risks and benefits. In Kay and King’s book Radical Uncertainty, the key to managing risks is to figure out “what is going on.”6 Sorting out tangled risks can only be achieved by simultaneously understanding and managing the attributes of interconnected risks and benefits. The SRS approach provides an effective method of combining risk and benefit events by structuring them as system inputs and outputs to identify, analyze, and, when necessary, manage and balance them for comparison and eventual acceptance.
System Risk Structures
An SRS describes the flow of threats through systems to produce risk consequence events.4 Just as threats flow through systems, opportunities also flow through systems to result in possible benefits. Figure 1 shows a basic element of an SRS. A lexicon of terms for Figure 1 and the SRS approach is provided in the appendix.

Figure 1 – A basic SRS element is an input – system – output model of a risk. A risk must be defined by all three components. The inputs are both threats and opportunities, and the outputs are risk consequences and benefits. The only difference between a threat/opportunity event and a risk/benefit event is the system that produces them.
The single element can be used as an SRS by grouping small systems or processes into a larger system for analyzing various input threats and opportunities to describe how they might produce both benefits and risk consequences. An example of such an approach, focusing on risks, is to describe an entire manufacturing enterprise as a system for analyzing external threats such as fires, floods, and earthquakes. The risk consequences that might result from the threats are lost product, production delays, damaged manufacturing resources, etc. In this example the benefit is derived by preventing the risk consequence.
A simple SRS of a manufacturing enterprise can be used by a team of experts to evaluate the severity and likelihood of risk consequences resulting from various external threats. The experts would estimate the likelihood of the enterprise’s systems controlling each possible threat to mitigate or prevent important risk consequences. Such a risk analysis would identify and screen important threats and risk events for further analysis using more detailed SRSs. For example, a more detailed SRS might be constructed to describe the flow and control of the earth’s movement from an earthquake through the building to analyze the severity and likelihood of structural failures that might in turn result in other risk consequences, such as injured personnel, lost product, and production delays.
The risk element can be used to build sequences and networks of systems to understand more complex risk problems. As shown in Figure 1, a system has two inputs, the primary threat and secondary factors and inputs. The secondary factors impact the system’s ability to control the primary threat as well as introduce other threats to the system. Since every threat and secondary factor comes from prior systems, an SRS can be expanded into a sequence or network of systems. The manufacturing enterprise can be divided into interconnected manufacturing process unit operations, facility functions, and infrastructure quality management systems (QMS) to show the flow and control of threats that could result in risk consequences. In the case of unacceptable risks, the SRS can be used to identify new or improved subsystem control strategies required to reduce the likelihood of the threats or improve the system’s ability to control the threats. When appropriate, a similar SRS can be used to understand how opportunities become benefits.
In this article, both threats and benefits will be discussed. In many cases, the initial input is an intentional event or action intended to derive a benefit. As shown in Figure 2, realizing the benefit is combined with various risks from secondary factors and inputs to the system.
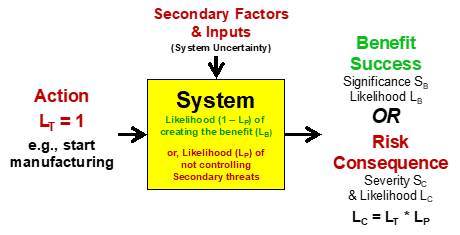
Figure 2 – If an action (an event with LT =1) is taken to produce a benefit, then realizing the benefit may have associated risks. To manage those risks, a risk analysis must estimate the impact of secondary factors that might prevent the benefit from being realized.
The action-initiated SRS shown in Figure 2 occurs frequently with pharmaceuticals. In many cases, both the risk and benefit have the same subject. One frequent action is to start manufacturing. The system is composed of all the subsystems or processes that include all the equipment, instruments, procedures, facility assets, and personnel required to manufacture the product. The benefit is a result of producing the product. The risk consequence is a failure to complete the production campaign, resulting in lost product and lost manufacturing costs.
The likelihood of deriving the benefit LB is 1 – LC because if the risk consequence occurs, the benefit is not realized. In many cases, the severity impact of the risk SC is similar to the significance impact of the benefit SB. However, if the value of the product SB is the market value of the product’s sales and the risk loss SC is valued as just the manufacturing cost, then SB may be much greater than SC. In other cases, the severity of the risk might be much greater than the significance of the benefit. For example, the risk consequence of a child taking an aspirin may be far larger than the benefit, while the benefit of taking a vaccine may far outweigh the possible risk consequences.
When appropriate, the SRS in Figure 2 can be changed to show the secondary factors as the primary threats, as shown in Figure 3. The revised SRS describes how other threats might result in risk consequences that could prevent realizing the hoped-for benefit.

Figure 3 – Example of a follow-up SRS after an action to begin manufacturing. The SRS can then be used to estimate the likelihood of a failure to complete the manufacturing campaign. If a risk consequence occurs, then the benefit is not achieved. When appropriate, separate SRSs can be constructed for each primary threat.
Another example of an action-initiated risk-benefit situation is the decision by a patient to take a drug. In this case, the system is the patient, and the secondary factors are their health, medical history, and genetic and epigenetic makeup, etc. which affect their response, both good and bad, to taking the drug. Obviously, an important threat input would be the drug’s potency and purity.
In some cases, an action or other threat/opportunity event might pass through different systems to impact different subjects. Figure 4 shows a simplified SRS for a case where the input event passes through different systems to provide a risk consequence for one subject while the same threat/opportunity event passes through a different system to benefit a different subject.
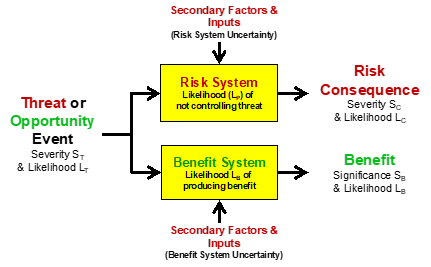
Figure 4 – An SRS starting with a single event input to a risk system and a benefit system. The same input event may impact two different subjects.
The systems shown in the SRS in Figure 4 can be expanded to understand the impact of secondary factors on the performance of the respective systems. Because the only difference between a threat and a risk consequence is the system that produces it, the threat shown in Figure 4 could produce both risks and benefits. Earthquake damage could have severe consequences to the enterprise’s owner but could also be a major benefit to the contractors required to repair the damage. The systems can be expanded into sequences and networks to better describe the performance of the systems to prevent risk events or generate benefits.
Evaluating And Rating Risk And Benefit Events
Both risk consequences and benefits have the attributes of impact and likelihood of occurrence. In the case of a risk event, the impact is measured by its severity SC and its likelihood of occurrence as measure by a probability LC. In the case of a benefit, the impact is measured by its significance SB and the likelihood of occurrence LB. The impact ratings for both are shown in Table 1.

Table 1 – The table represents the severity of a risk event and the significance of a benefit event. The scales are logarithmic representations that must be scaled based on the subject’s needs or preferences. The rating for SC is SC^ and SB is SB^
Based on the subject, both scales can be adjusted up or down based on the subject’s definition of very minimal impact as a baseline definition. As shown in Table 2, likelihood of occurrence is similarly rated based on probability.
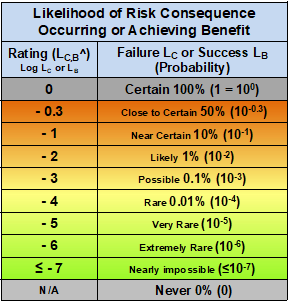
Table 2 – Likelihood of occurrence for both the probability of realizing a risk and probability of achieving a benefit event. The scale is logarithmic, ranging from certain (100%) to nearly impossible (≤ 10e-7). The rating for LC is LC^ and the rating for LB is LB^.
The likelihood table uses a baseline rating of 0 for a probability of 1 (100% certain), with rating values the log of the probability. Both the severity/significance and likelihood tables use logarithmic scales to span six-plus orders of magnitude.
Estimating likelihoods for either risks or benefits can be challenging. For gambling, both attributes are well defined by the rules of the game. For many risks, estimating uncertainty is difficult, requiring a sufficient level of knowledge and experience with the systems while maintaining a reasonable level of objectivity to control bias uncertainty. For many problems, prospective causal risk modelling (PCRM) can be used to provide estimates of likelihood of occurrence.7
With the rating scales defined, the next challenge is to understand and describe the relationship between the two attributes for risks and benefits.
Risk Benefit Impact And Likelihood Maps
Some insights into balancing risk events and benefits can be gained by plotting the values in Tables 1 and 2 to generate impact/likelihood maps for both risk events and benefits. The baseline for both maps is generated from zero severity/significance and zero likelihood of the risk occurring or the benefit being realized. For either a risk event or a benefit, a point on the map can be estimated showing the balance between impact and likelihood of the event.
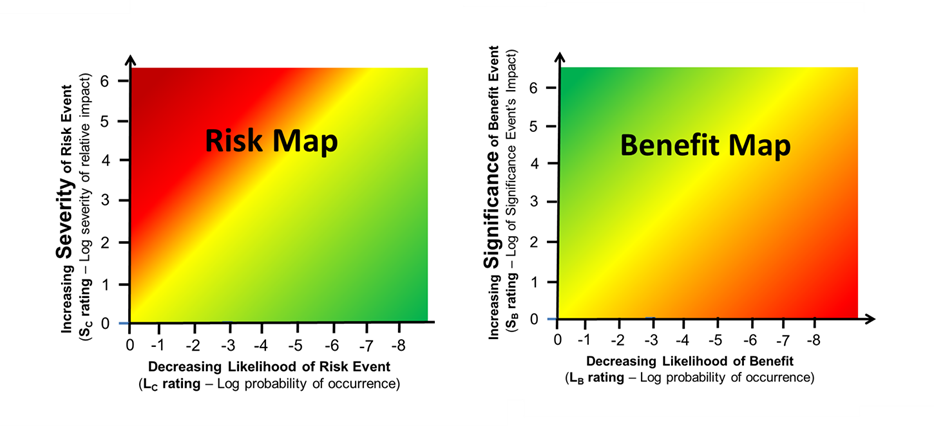
Figure 5 – Combining Tables 1 and 2 produces a map for risks on the left and benefits on the right. The decision to accept a risk in an attempt to receive a benefit can vary widely depending on personal preferences and biases.
The acceptance or rejection of either the risk or benefit can be determined based on a number of subjective factors, including the bias, prejudices, and preferences of the deciding individual or team. In some cases, the two attributes can be combined for a quick reference number for communications and discussions.
In the case of a risk event, the number is the adjusted risk likelihood (ARL)8 and, for a benefit, the adjusted benefit significance (ABS). The ARL is the sum of the likelihood of occurrence rating LC^ and the severity scale rating SC^. The ARL is essentially a risk event’s likelihood discounted by its severity.8 For benefits, a similar metric is the ABS, calculated as the sum of the benefit’s significance rating SB^ and likelihood rating LB^. The ABS discounts the significance of a possible benefit based on the likelihood of successfully achieving that benefit.
The ARL and ABS can be used independently to quickly communicate risk and benefits. As a basic guidance, the smaller the ARL value, the better. On the other hand, the larger the ABS value, the better. As a quick measure of value to the risk/benefit trade-off, the ARL can be subtracted from the ABS to give a risk/benefit score or RBS. The values shown in Figure 6 basically discounts the net value of the benefit as measured by the ABS by subtracting the net likelihood of the risk as measured by the ARL.

Figure 6 – A risk benefit score is calculated as (ABS – ARL). In general, a positive RBS is a favorable benefit given the risk, while negative RBS values may indicate excessive risk given the benefit.
The larger the RBS number, the better – more benefit for the risk taken. RBS values around 0 can be viewed as balanced but should be considered with caution. RBS scores well above 0 could be viewed as good risks, while low negative numbers are probably risk/benefits not worth taking, with significant risk reduction or risk avoidance worth considering.
Summary: Comparing Risks And Benefits
Managing risks frequently involves balancing taking a risk to achieve a benefit. An SRS can assist in structuring risks and benefits to better understand and balance the two for acceptance. Generally speaking, risks are managed according to their likelihood of occurrence while benefits are managed according to the significance of realizing the possible benefit. The ARL and ABS provide quick measures for balancing the two. For any risk situation, the two can be compared to understand whether the possible benefit is worth the risk.
In a lottery, the benefit is very high but very unlikely, while the risk is very low but virtually certain. Thus, the ARL and ABS values are very similar, making the acceptance decision largely based on the enjoyment of playing the game and the fantasy of a brighter future. On the other hand, taking a vaccine may have significantly different ARL and ABS values. The side effects of taking a vaccine have a relative low severity and low likelihood of occurrence, producing a very low ARL, while the benefits of being vaccinated have a high likelihood of preventing serious disease, reducing anxiety, thus resulting in a high ABS.
SRS provides a valuable intuitive framework for understanding both risks and benefits. However, SRS and PCRM can also be used to provide very detailed risk/benefit analysis of complex systems to identify, analyze, and manage a wide variety of risks.
References
- ISO 31000:2018 – Risk Management – International Organization for Standardization.
- FDA (CDER/CBER) – Guidance for industry: ICH Q9 quality risk management. June 2006. ICH.
- Witcher MF, Revising Annex 1: A Case Study In Controlling Operating Risks By Understanding Uncertainty, Pharmaceutical Online, November 13, 2020. https://www.pharmaceuticalonline.com/doc/revising-annex-a-case-study-in-controlling-operating-risks-by-understanding-uncertainty-0001
- Witcher, M. “System Risk Structures: A New Framework For Avoiding Disaster By Managing Risks,” Pharmaceutical Online, July 13, 2020 https://www.pharmaceuticalonline.com/doc/system-risk-structures-a-new-framework-for-avoiding-disaster-by-managing-risks-0001
- Witcher MF, Analyzing and managing biopharmaceutical risks by building a system risk structure (SRS) for modeling the flow of threats through a network of manufacturing processes. BioProcess J, 2017; 16. https://doi.org/10.12665/J16OA.Witcher
- Kay, J. & M. King, Radical Uncertainty – Decision Making Beyond the Numbers, W.W. Norton & Company, 2020.
- Witcher MF, Estimating the uncertainty of structured pharmaceutical development and manufacturing process execution risks using a prospective causal risk model (PCRM). BioProcess J, 2019; 18. https://doi.org/10.12665/J18OA.Witcher
- Witcher MF, Rating Risk Events: Why We Should Replace The Risk Priority Number (RPN) With The Adjusted Risk Likelihood (ARL), Outsourced Pharma, April 7, 2021. https://www.outsourcedpharma.com/doc/rating-risk-events-why-we-should-replace-the-risk-priority-number-rpn-with-the-adjusted-risk-likelihood-arl-0001
Appendix: System Risk Structure Lexicon
Since the risk literature has many confusing terms, some having multiple imprecise meanings, the terms used in this paper are defined as follows:
- Event – something that happens, such as a change, particularly in value or impact, in a moment in time. Benefits, risk consequences, threats, and opportunities are events.
- Threat – a possible input event of likelihood LT that might pass through a system or process to result in a loss. Many threats are also opportunities. A threat is produced by a prior system.
- Opportunity – a possible input event of likelihood LT that might pass through a system to result in a benefit. An opportunity is also a threat. An opportunity is produced by a prior system.
- Action – any deliberately initiated event (LT = 1) that is both a threat and an opportunity. An action is produced by a prior system.
- Benefit – an output event from a system that results in a gain (increase in value) to a subject. The benefit’s significance is SB and likelihood is LB.
- Risk Consequence or a “risk” – an output event from a system that results in a loss (decrease in value) to a subject. The risk consequence’s severity is SC and likelihood is LC.
- Subject – a person or organization that experiences a gain or loss from an event. The subject harmed by a risk consequence is the risk subject and the subject benefiting from the risk is the benefit subject. In some cases, the risk subject and the benefit subject may be the same.
- Secondary Factors & Inputs – other inputs to the system that may adversely impact or improve the system’s ability to control threats or opportunities. Secondary factors may also be significant threats or opportunities. These inputs also come from prior systems or processes, resulting in the creation of sequences and networks of systems.
- System – any sequence of actions, activities, and processes that takes an input event (threat or opportunity) and produces an output event (a risk or benefit). The probability that the system will propagate either a threat or opportunity to result in a risk consequence or benefit is the likelihood LP.
- Risk – the “effect of uncertainty on objectives” (ISO 31000)
- Likelihood – the probability of an event’s occurrence LC for a risk consequence or LB for a benefit.
- Severity – the negative impact value of a risk consequence SC or a risk.
- Significance – the positive impact value of a benefit SB.
- Uncertainty – the collective impact of beliefs, biases, prejudice, knowledge level, and likelihood of occurrence.
- ARL – Adjusted Risk Likelihood calculated as the LC^ value plus the SC^ value. ARL = (LC^ + SC^)
- ABS – Adjusted Benefit Significance calculated as the SB^ value plus the LB^ value. ABS = (SB^ + LB^)
- RBS – Risk-Benefit Score calculated as the ABS minus the ARL. (RBS = ABS – ARL). An alternative form is RBS = (SB^ – SC^) + (LB^ – LC^).
About The Author:
 Mark F. Witcher, Ph.D., is a bioprocess operations expert with 35 years of experience in the biopharmaceutical industry in a wide variety of executive, consulting, and engineering roles. Previously, Mark was a member of NNE’s Strategic Manufacturing Concept Group after working at IPS on feasibility and conceptual design studies for advanced biopharmaceutical manufacturing facilities. He has more than 25 years of experience as a consultant in the biopharmaceutical industry on operational issues related to product development, process validation, strategic business development, clinical and commercial manufacturing planning, tech transfer, and facility design. He was previously senior vice president of operations at Covance Biotechnology Services and vice president of manufacturing at Amgen, Inc.